As a DTC brand, how much revenue do you need to make a profit?
Or how much can you grow without making a loss?
Or how many units do you need to sell to cover your fixed costs?
Essentially every business comes down to –
- Growing the business (aka top line)
- Making a profit (aka bottom line)
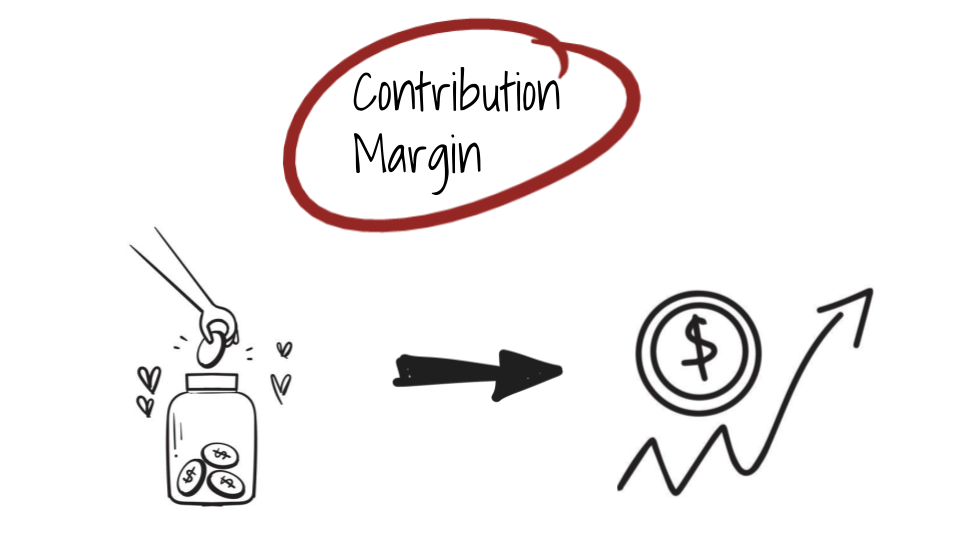
One metric that ties both growth and profits is the contribution Margin.
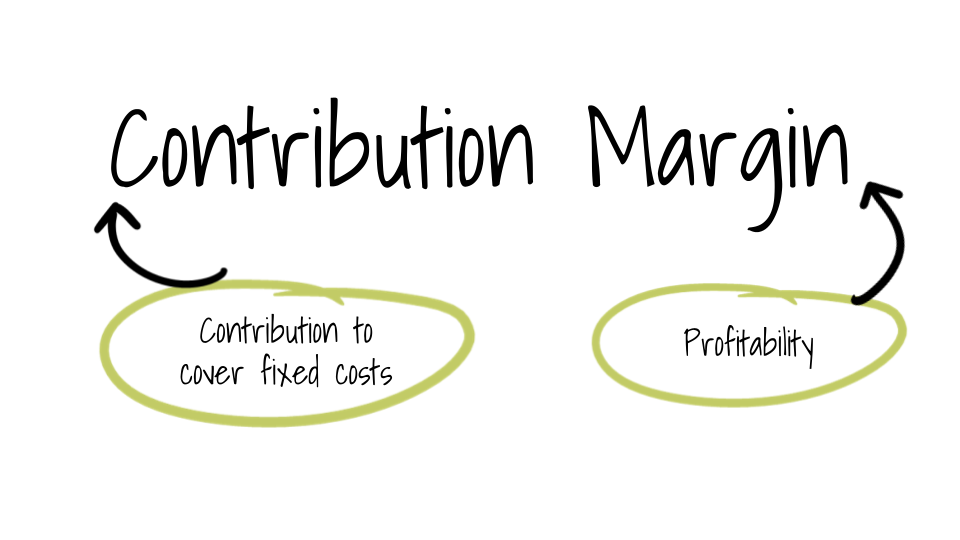
In short – How much Margin (or profit) each sale is generating to Contribute towards your fixed cost.
Contribution to cover fixed costs.
The goal of each sale is to generate some profit, which eventually will allow you to cover your fixed costs and make a profit.
Why Contribution Margin should be a North Star of your Marketing Efforts?
What’s the goal of marketing? To generate more demand for your product.
The contribution margin will tell us whether we have enough demand to cover fixed costs.
Or do we even have a positive demand that is sustainable?
Or if our projected growth projections are sustainable?
All your marketing efforts should be directed toward reaching the point where the overall contribution margin will cover the costs while meeting growth targets.
Optimizing your marketing efforts for any other metric can lead to short-sightedness.
More importantly, as it sits in your P&L, it has a direct impact on your business.
If you are able to grow with a positive or higher contribution margin, then it’s GOLD.
You don’t need to worry about anything else.
If you are growing with a negative contribution margin, then it’s not sustainable.
#1 Challenge for any DTC ecommerce brand is to balance Growth while maximizing contribution margin.
How To Calculate Contribution Margin
Contribution Margin = Revenue – Variable Costs
Everything you need to spend to get and fulfill the order. Except for your fixed costs.
Variable costs would include your marketing, shipping, payment gateway charges, and cost of goods sold.
Suppose for a Sandals
- Selling Price: $50
- Variable Costs: $40 (Marketing + Shipping + Payment Gateway + COGs)
- Contribution Margin for Product $50 (Selling Price) – $40 (Variable Costs) = $10
Revenue required to Break-even
With contribution margin, you can begin to think in terms of the number of units you need to sell to break even.
Revenue required to breakeven = Fixed Costs / % Contribution Margin
Units required to breakeven = Fixed Costs / (AOV x % Contribution Margin)
Contribution Margin First Principles Breakdown
Now, time to break it up into actionable
Using first principles thinking it’s made up of 3 things
Contribution Margin =
(+) Net Revenue
(-) Total Delivery Cost
(-) Marketing Spend

To increase the contribution margin, we would want to increase net revenue and decrease the cost of delivery and marketing spend.
In effect, to increase the gap between net revenue and rest.
So we have 3 levers: net revenue, cost of delivery, and marketing spend.
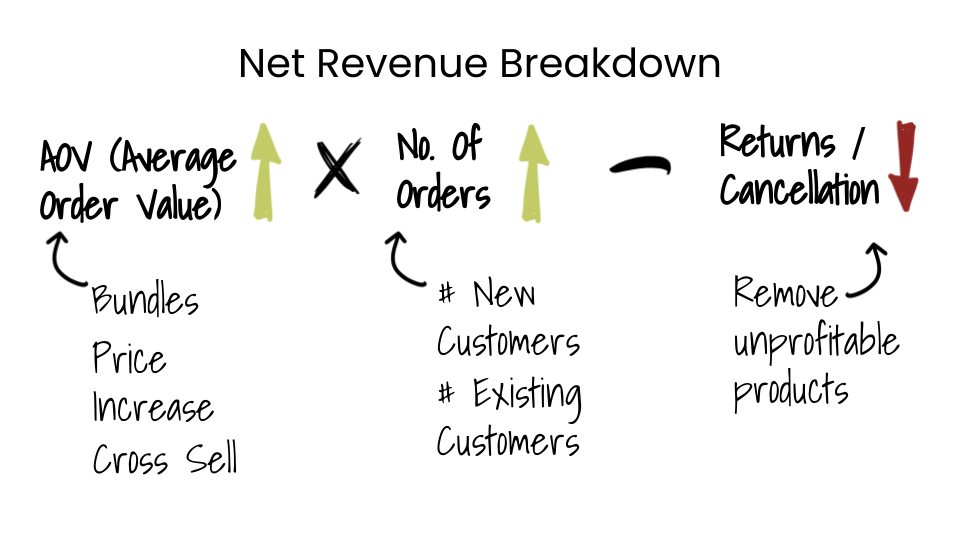
Net Revenue Breakdown
Net Revenue =
(+) AOV (Average Order Value)
(+) No. Of Orders
(-) Returns / Cancellation
To increase net revenue, we can increase AOV and no. of orders and decrease returns or cancellations.
Going further,
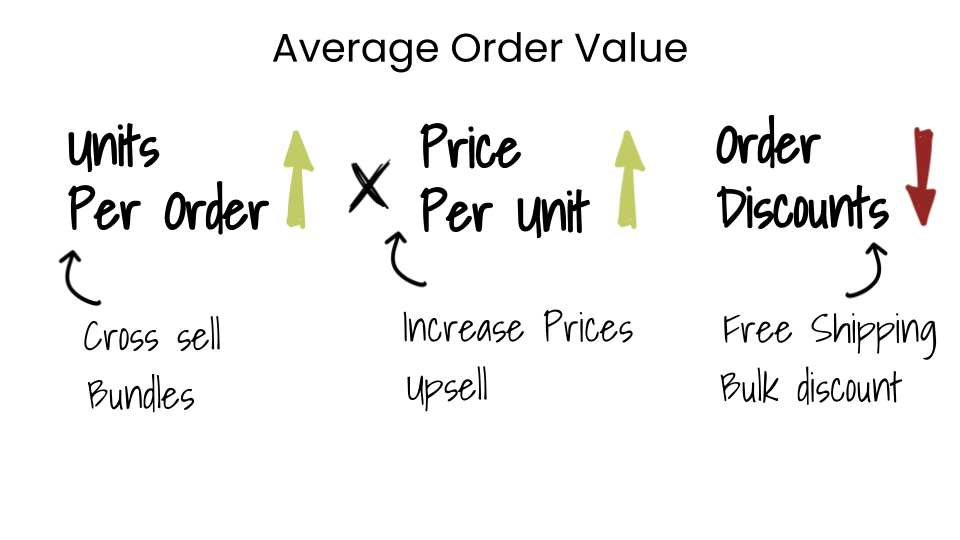
AOV (Average Order Value)
Average Order Value =
(+) sell more units per order
(+) raise per unit price
(-) reduce discounts
To increase the average order value, we need to increase per unit price or sell more units per order and reduce discounts.
Count of orders
No. Of Orders =
(+) From Existing Customers
(+) From New Customers
Orders from new customers can be further divided into new customers from organic sources or high-cost acquisition.
By each channel and traffic source.
The customer is more important than the channel, as channels can get confusing and provide overlapping figures due to attribution.
Total Delivery Cost Breakdown
The total delivery cost would include your cost of goods sold (COGs), payment gateway or platform charges, packaging charges, 3PL costs, and shipping costs.
Total Delivery Cost =
(-) COGS
(-) Payment Gateways
(-) 3PL costs
Apart from COGS, there are very few things you can optimize for.
Most pricing in this section is volume-based. So once you have a higher volume, it’s always best to renegotiate.
The best tip is to renegotiate the contract every 6 months once you see volume change.

Marketing Spend Breakdown
Marketing spend is a breakdown of your spend on new customers and repeat customers.
In this, we can split the new customers from organic (low cost) channels and paid channels.
Marketing Spend =
(+) Spend for new customers from organic channels
(+) Spend on existing customers
(-) Spend for new customers from paid channels
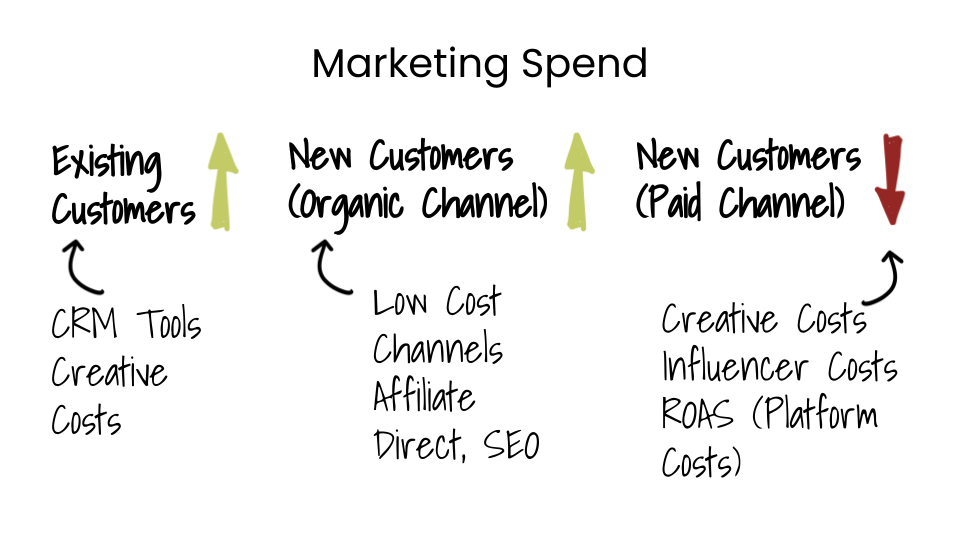
Again the spending would include comprehensive numbers and not just channel-based numbers.
Paid marketing spend can be divided into retargeting spend vs. cold traffic spend.
Creative costs & Influencers costs
Similarly, marketing spends on existing customers would include – CRM tool costs & creative costs
We can continue breaking down the metrics, but based on the above analysis, we can finalize some broad strategies to improve the contribution margin.
Strategies To Improve Contribution Margin
1. Increase revenue from existing customers
2. Raise the average order value of first and repeat purchases
3. Increase price for higher margins
4. Increase margins by reducing COGs
5. Increase the marketing efficiency ratio to get more bang for the buck on paid channels.
6. Increase revenue from organic or cheap sources.
7. Determine your most/least profitable products. Remove problematic products to reduce returns.
Will look into each of them in future articles, but this will give you a good starting point.
To summarize, we looked at the components of each top-level metric, how they are built, the factors influencing them, and what we can do about them.
Exact actionable depends on the current state of the business and what levers you can actually improve upon given the resources.
Tell me your favorite strategy to improve your contribution margin in the comments below 👇
Remember, managing your contribution margin will help you grow with profitability and make better decisions.

