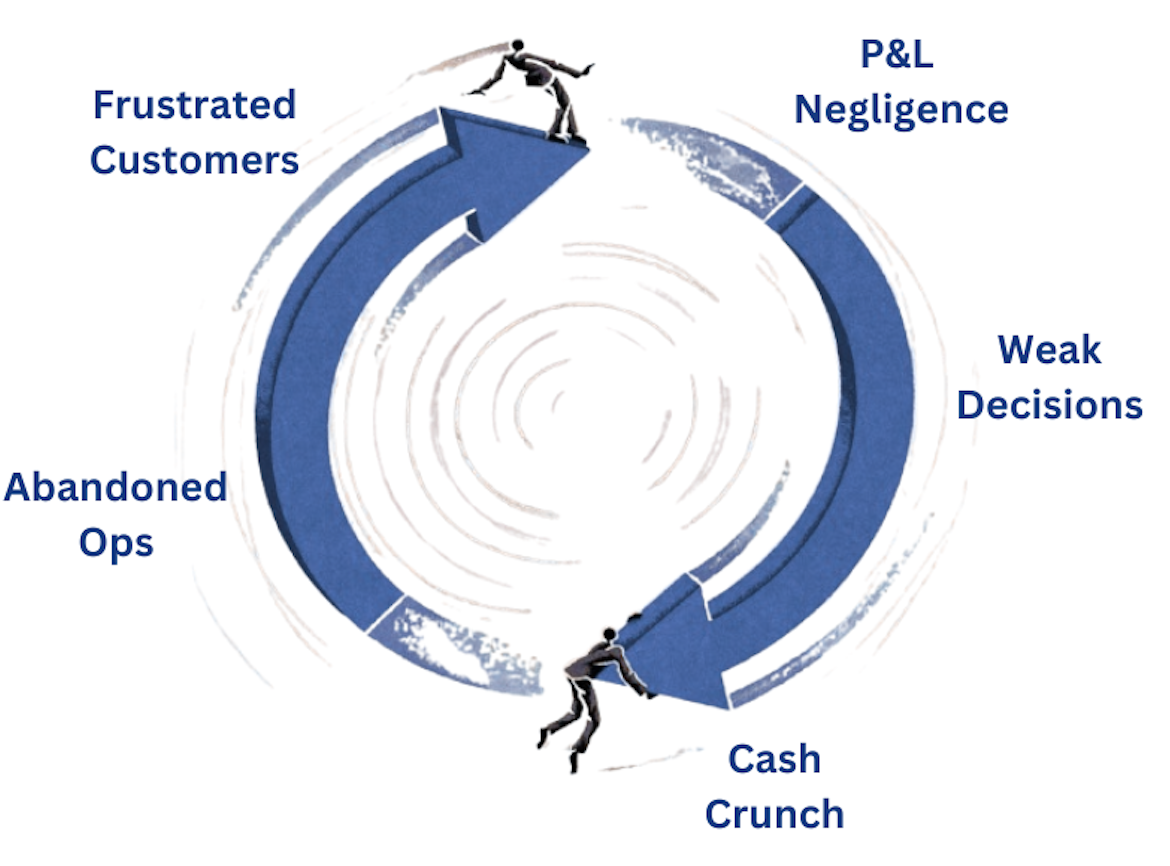

You’re not losing money to one big problem.
You’re losing it to six small ones that feed each other.
And the reason you haven’t fixed them yet is not that you don’t care.
It’s because you are looking at revenue, the number that tells you what already happened, and concluding that things are fine.
But revenue is the lagging number. By the time it shows you a problem, the inputs that created that problem have been running against you for months.
This blog is about those inputs. And about why fixing one leak in isolation never fully works.
The Scene Every DTC Founder Has Lived
It’s Monday morning.
- Marketing launches a flash sale on three SKUs. Nobody checked inventory levels.
- Two of the three SKUs sell out in 36 hours. Not because demand was unpredictable, but because 40 units were sitting in a returns processing queue and weren’t counted as sellable. The inventory number looked fine. The available inventory wasn’t.
- WISMO tickets spike. Your support team diverts from a pricing dispute that needed resolution.
- Your ops lead spends three hours pulling data from Shopify, the 3PL portal, and a spreadsheet that doesn’t agree with either of them.
- By the time you make the reorder decision, the volume discount window has closed.
- The emergency PO goes out at 15% above standard pricing.
The next quarter, your return rate ticks up 1.5% – customers who got delayed orders substituted products that didn’t fit as well.
The margin had already compressed on Thursday when the emergency PO went out at 15% above standard.
The return rate just confirmed the damage was wider than you thought.
You open the P&L three months later and you can’t figure out where the quarter went wrong.
It went wrong on a Monday in January. It just didn’t show up until March.
The 3 Pain Points Underneath the Compounding
Pain Point 1: You Fix Leaks One at a Time When They’re Connected
You tighten up inventory. Good
But your return rate is still 11% and 30% of returned items are going into the processing queue rather than back to sellable stock.
So your actual available inventory is lower than your count suggests.
Which means your “fixed” inventory is still driving late replenishment.
Which still causes stockouts.
Which still generates WISMO tickets.
Which still burns your support team’s capacity.
You fixed one pipe. Three others were still leaking into the same bucket.
You think the compounding was just financial? Look deep within because it’s “operational as well.”
One leak creates the conditions for the next one to run unchecked.
And because each leak looks like a separate problem, you treat it separately.
But they’re not separate. They’re a sequence.
Pain Point 2: Growth Masks the Leaks Until It Can’t
Revenue went up 22% last year. The business felt like it was working.
It was. And it wasn’t.
At $2M, a 9% return rate costs you $36,000 in processing. Annoying but manageable.
At $5M, the same 9% return rate costs you $90,000. Painful and urgent.
At $8M, it costs you $144,000 and it’s now structural, baked into your cost base.
You didn’t acquire a new problem.
The same leak grew with you.
Growth didn’t fix it. It pressurised it.
And because revenue was going up, the dashboard looked fine.
But the inputs feeding your actual financial strength, inventory cover, return rate, WISMO rate, decision latency, gross margin, were quietly degrading.
Revenue is what has already happened. Those inputs determine what happens next.
Pain Point 3: The Operational Debt Accumulates in Silence
Financial debt has an interest rate. You see it in a statement. It charges you visibly.
Operational debt doesn’t announce itself. It just quietly increases the cost of everything.
- Your support team hires a new agent to handle WISMO volume, not because the business grew, but because the fulfilment process got noisier.
- Your ops lead spends four hours a week reconciling inventory data between three systems that don’t talk to each other, not because the work grew, but because the reporting process was never fixed.
- You spend Tuesday in a decision meeting that should have been a 20-minute call, not because the decision was complex, but because nobody had the right data to decide without one.
None of these are line items on a P&L. They’re just the cost of running a business that hasn’t fixed its leaks.
Until the quarter where they are.
What the Inputs Actually Look Like When Leaks Are Running
Most founders track revenue. But revenue is the lagging number as it tells you what already happened.
By the time it shows a problem, the inputs that created that problem have been running against you for months.
Here’s the difference:
A founder with compounding leaks:
You open your laptop Monday morning.
Revenue is up 18% on the same period last year.
You feel good. You close the tab and go to the first meeting.
Three weeks later, your bookkeeper sends the monthly P&L.
Gross margin is down 3.2 points. Y
ou spend an hour trying to figure out why.
Nobody can tell you clearly.
A founder with clean inputs:
You open your scoreboard Monday morning.
Inventory WOC on your top-10 SKUs is at 9.4 weeks, inside range.
Return rate is 6.2%, down from 7.1% last month.
WISMO rate is 3.8% of orders, below your 5% threshold.
Gross margin is 54.1%, up 0.6 points on last month.
You have one flag: SKU 14 is at 17 weeks of cover. You send a message to your ops lead before the meeting starts. By Tuesday, it’s been addressed.
Same revenue number. Different financial future.
The Real Cost of Six Connected Leaks
Here is what six leaks running simultaneously cost a $5M DTC brand annually:
| Leak | Annual Cost |
|---|---|
| Inventory carrying cost | $100,000–$150,000 |
| Supplier discounts missed | $20,000–$48,000 |
| Fulfilment errors | $30,000–$60,000 |
| WISMO support cost | $60,000–$120,000 |
| Returns processing | $80,000–$150,000 |
| Decision latency | $105,000–$180,000 |
| Total | $395,000–$708,000 |
None of this caused by one bad decision.
All of it caused by six leaks running simultaneously, feeding each other, compounding quietly, while the revenue number stayed green.
The Leak Map: Making the Invisible Visible
You cannot fix what you cannot see.
And you cannot see operational leaks in aggregate if you’re looking at them one by one.
The Leak Map is the diagnostic that surfaces all six leaks simultaneously, ranked by dollar impact.
It shows you what is leaking and how much each leak is costing you in your specific business.
But here is what the Leak Map doesn’t do and this is important.
It doesn’t show you how your leaks connect to each other.
Because that connection is different for every brand.
- A brand that started with dropshipping has a different chain than a brand that manufactures its own products.
- A brand at $3M has a different entry point than a brand at $7M.
The sequence depends on your business model, your stage, and your specific operational history.
What the Leak Map gives you is the diagnostic input, the what and the how much.
The connection analysis, which leak is feeding what in your specific business, and which fix unlocks the chain, is what we work through together.
And that is what makes the fix stick. Because you’re not patching leaks one by one.
You’re understanding the system they’re part of and fixing it at the right point.
The Question Worth Sitting With
If someone looked at your six operational inputs today, not your revenue, not your growth rate, but the actual mechanics of how your business runs, what would they see?
A business getting measurably stronger each month?
Or six small leaks quietly feeding each other while the revenue tab stays green?
Revenue will fluctuate. Markets will wobble. But a business with clean operational inputs, inventory moving, margins holding, decisions made fast, leaks identified and ranked, compounds toward strength every month, regardless of what the market does.
That’s not a revenue goal. That’s a systems goal. And systems are what you control.
Let’s create your Leak Map and diagnose which leaks are creating more leaks.
Book a free 30-minute Operations Maximizer session → calendly.com/arti-retainup-core5-os/operations-maximizer-strategy-session
Arti is a fractional COO and eCommerce operations consultant helping DTC founders in the $3-$8M range identify and fix the six operational leaks quietly draining their cash: using the CORE5 OS framework. Built from scaling and closing a $20M DTC brand.