

Customers are not created equal.
Breaking customers into homogenous groups – called segments, helps with better understanding, and improves targeting and communication to drive better results.
Sounds easy and powerful.
The only problem is it goes out of hand very soon.
You can segment on geographic, demographic, technological, behavioral, and whatnot. Also on each segment (maybe 100+), you need to make different marketing strategies. Not worth my time and effort.
RFM analysis simplifies all this.
What is RFM Framework?
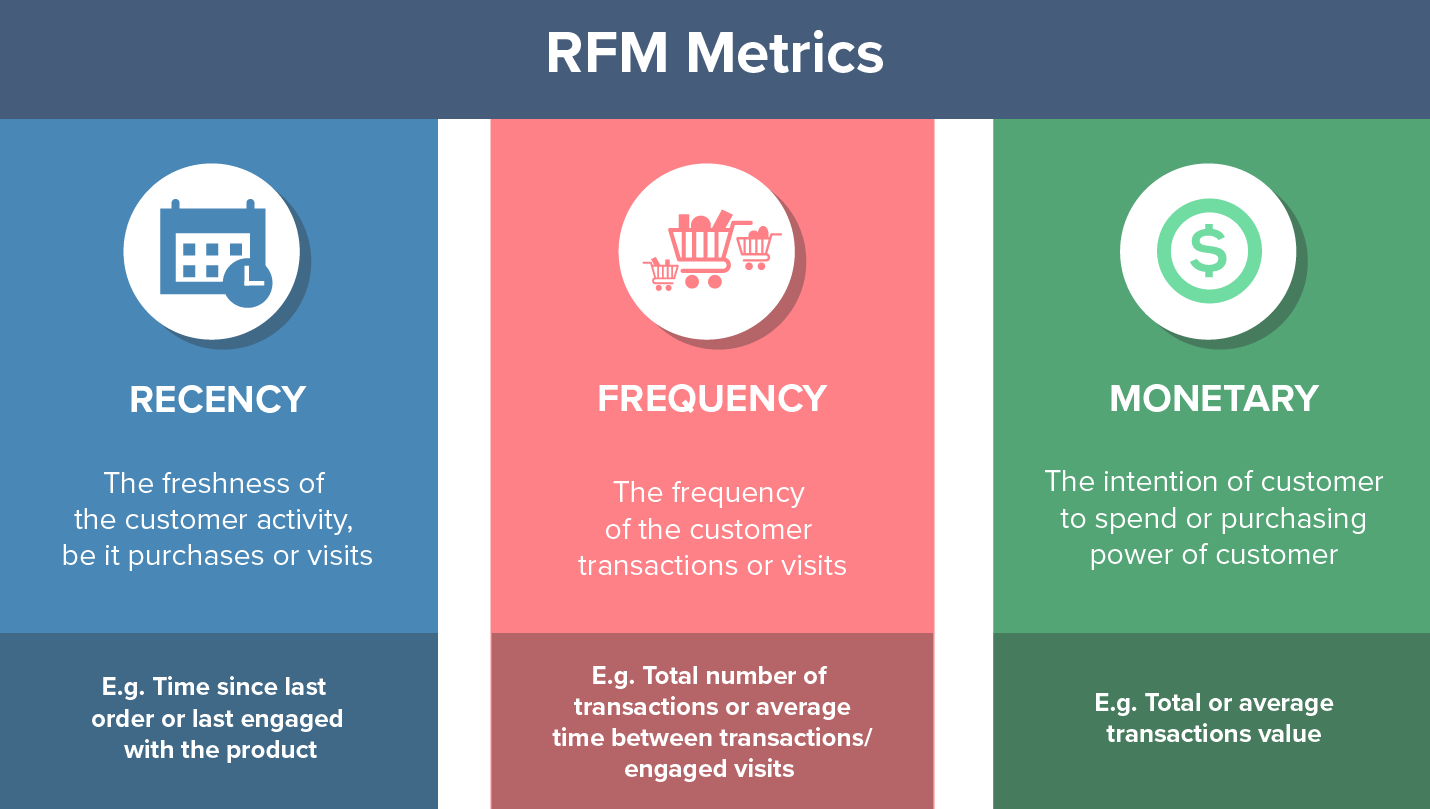
RFM stands for segmenting your customer base on Recency, Frequency, and Monetary behavior took together.
Recency – How recently did the customer purchased or did the desired event?
Recency helps us with prioritization. Working on a recent interacted event is better than some event that happened a long time ago. For apps, it can be opened. Any metric you wish to increase. Even a category-related purchase can be part of it.
Frequency – How often do they purchase or do the desired event?
Frequency helps with behavior patterns. Anything that is done 5 times is different than done 1 time. So customers with 5 purchases are different from customers with 1 purchase.
Also tells us about the stickiness of the customer for the desired event.
Monetary – How much do they spend / monetary value of the desired event?
$$ helps with customers’ worth for the brand. Events like opens, clicks, visits can also be attributed to a fixed revenue or monetary value for a brand, like ARPU. It helps us showcase the value of a customer to the brand.
In ecommerce should be LTV (Lifetime value) of the customer.
The concept of RFM was originally introduced by Bult and Wansbeek in 1995. Primarily used by catalog marketers to minimize their printing and shipping costs while maximizing returns.
Looking at all of them together for a single customer is a key, otherwise, it will be imbalanced.
The beauty of RFM segmentation is looking at customers across multiple metrics, showing more nuanced and correct assessment.
Benefits of RFM Analysis
While working on improving metrics like conversion rate, retention rate or loyalty, average order value, a brand need to answer the following questions –
Who are your best customers?
Who is most likely to churn?
Who has the potential to become the best customers?
Which of your customers can be retained?
Which of your customers are most likely to respond to engagement campaigns?
Broadly RFM Analysis helps with –
- Analyse and study you best customer.
- By find your best customers, you can conduct interviews, surveys to know more about their preferences, reasons and needs.
- You can know which products they buy more, which traffic sources acquired them, which device / location they belong to.
- Monitor health of your user base.
- Finding customers about to churn.
- Working on already lapsed customers to re-engage them.
- Improve customer life time value.
- Better marketing and personalization
- Better email marketing to send customised messaging to different segments.
- New product launches or running experiments.
- Increase loyalty and user engagement.
- Minimise marketing costs and improve ROI
How To Do RFM Analysis?
Before starting with RFM Analysis, the main goal of the entire process is to find –
8-10 actionable segments to work on improving brand metrics.
RFM analysis starts with customer data to Recency / Frequency / Monetary metrics, mapping users into 3X3X3 or 5X5X5 matrix and finally grouping segments to come up with 8-10 actionable segments.
Before starting, we need to finalize 2 things –
- Desired Event For Analysis
- Mostly purchase, but you can do for any desired event. You can also bifurcate purchase to focus on purchase of category X and it’s patterns. But to keep things simple start with purchase.
- Timeframe of Analysis
- Max 2 years. Although recency takes care of that, but still life time value will become lop sided for taking very long timeframe for analysis.
Steps to do RFM Analysis –
- Collect customer data
- Scale Recency, Frequency, Monetary
- Create RFM Segments
- RFM Groups
- RFM Actionable Analysis
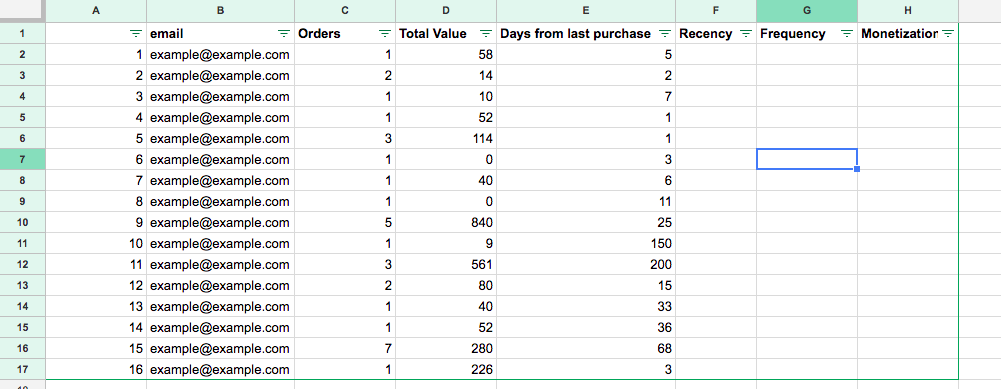
Step 1: Collect customer data
For mapping every customer, we need to start with the following data on 3 metrics –
For Creating RFM on Purchase Behavior
- Recency
- Date of last purchase
- Frequency
- Count of order placed in timeframe.
- Monetary
- Total order placed value by customer in timeframe.
For some different desired event analysis, on similar lines
◦ Last behavior did date/time. Like last order date.
◦ Total Interactions during time frame / Total orders in last year
◦ Total monetary worth during time frame / Customer lifetime value.
Once we have customer data, then we need to scale them on a comparative ruler.
Step 2: Scale Recency, Frequency, Monetary
This is the most tricky part and eventually impacts the complexity of the whole process – Setting the RFM scales.
If you are using a tool or app for doing RFM analysis, then Industry best practice is 5X5X5. But with a 5X5X5 grid, you will end up with 125 segments. That’s a lot for manual analysis.
For doing manual RFM analysis in Excel, I would recommend going for 3X3X3 as it’s easy and helps you keep your sanity. 27 segments are way easier to get done in excel than creating 125 segments.
The middle path is doing 4X4X4, 64 segments 🙂
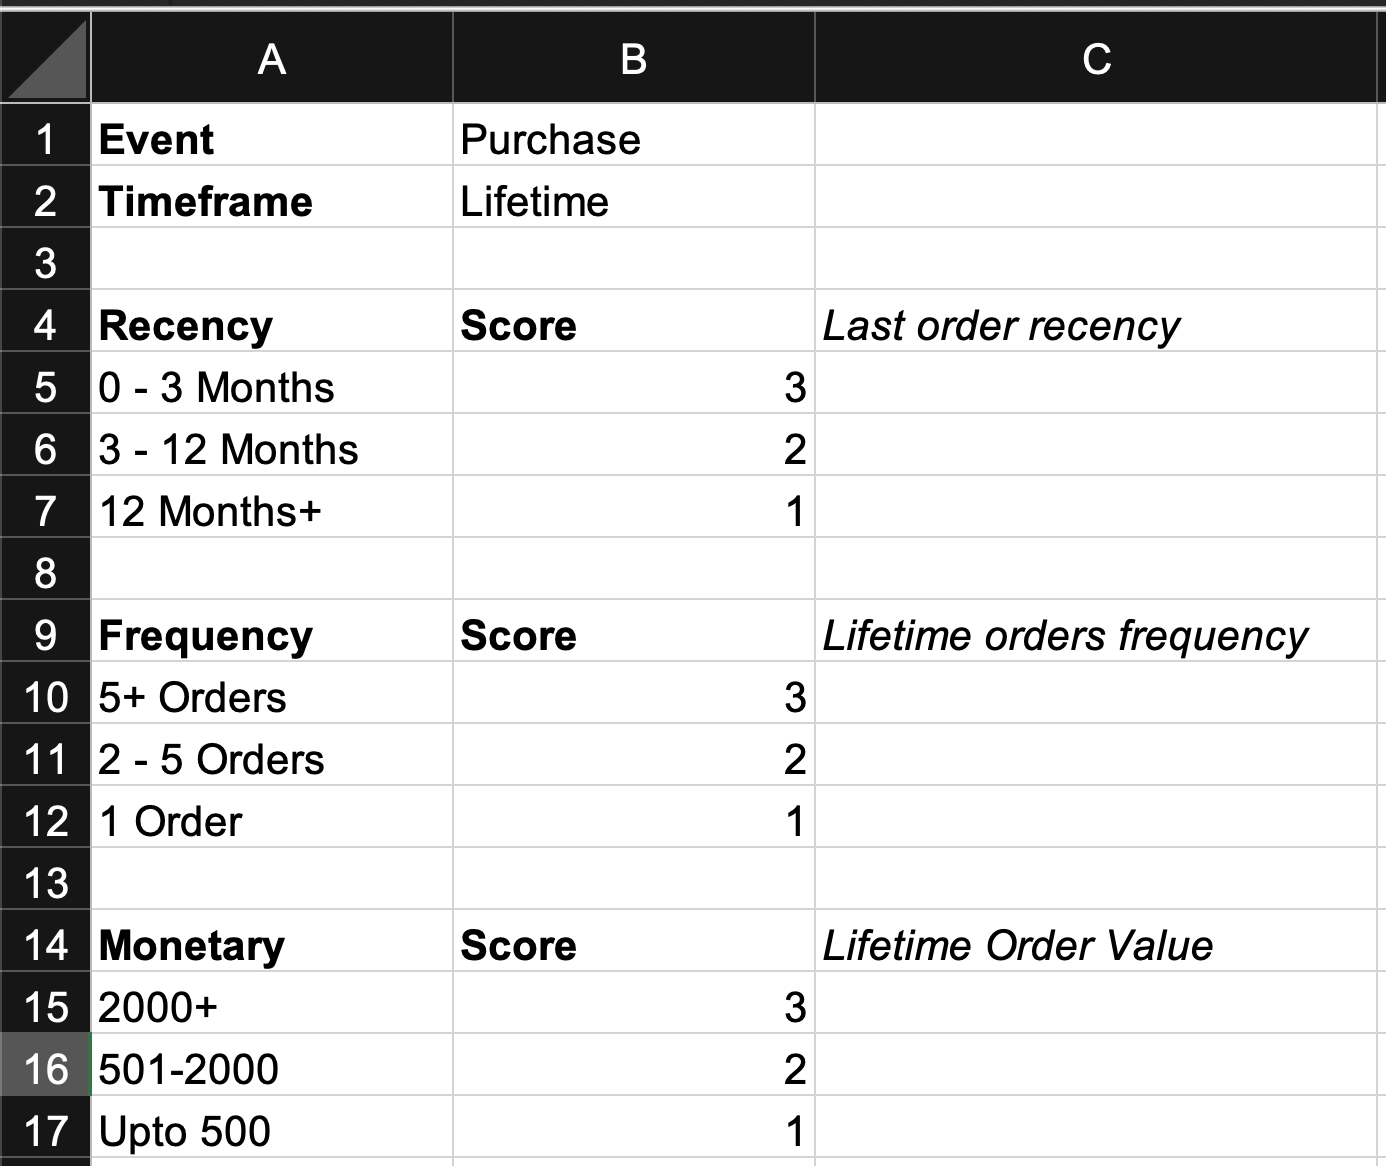
You can use 5 scale ranges, like –
| Score | Recency | Frequency | Monetary |
| 5 | Within Last Month | Placed 10+ Orders | $10K+ |
| 4 | Within Last 3 Months | Placed 6-10 Orders | $5-10K |
| 3 | Within Last 6 Months | Placed 3-5 Orders | $2-5K |
| 2 | In Last year | Placed 2-3 Orders | $1-2K |
| 1 | More than a year ago | Only placed 1 order | Upto $1K |
Key Points For Deciding Scale –
- Monetary, going bottom up, should start with 1 time of ASP (Average Selling Price). So 1 would be your brand ASP. Then moving forward toward 5.
- Recency starts from top and depend on actionable timeline you want to work with.
- Frequency depend on previous analysis of repeat rate of brand.
Don’t worry too much about getting it right the first time. You will come and adjust the scale depending on the actual count of users within those scales.
Now we have the customer data and scale ready, time to make some or many RFM segments.`
Step 3: Create RFM Segments
Now we need to give scores to users based on a scale
Start with mapping scale to customer data
Each customer should be given a score of Recency, Frequency & Monetary.
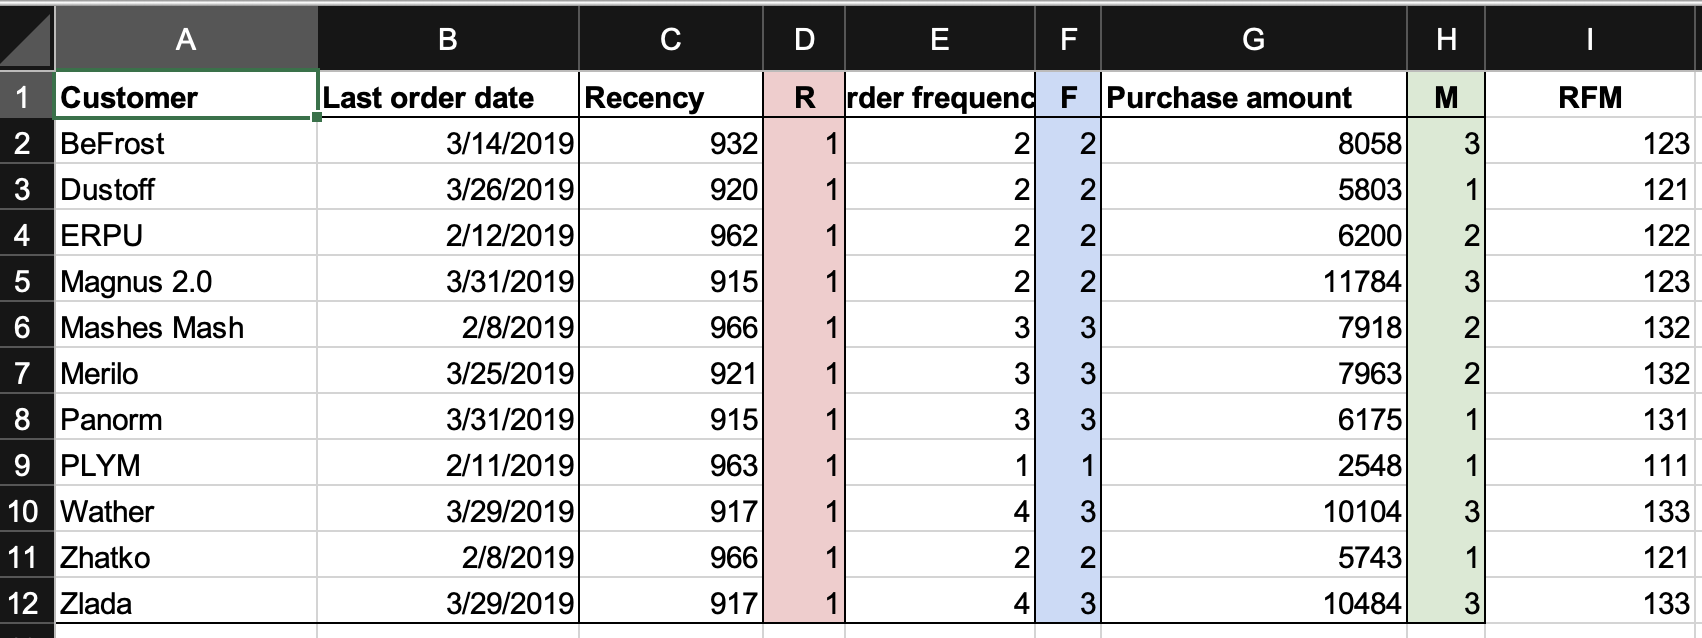
So we have every customer given a RFM score.
Once every customer is mapped, we can just create a pivot of the table to get to the count of RFM segments.
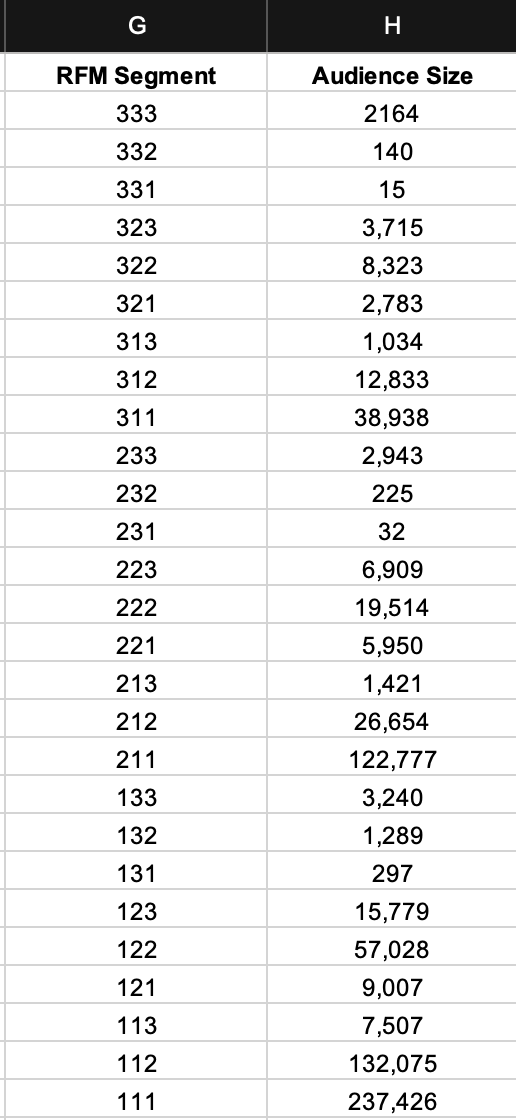
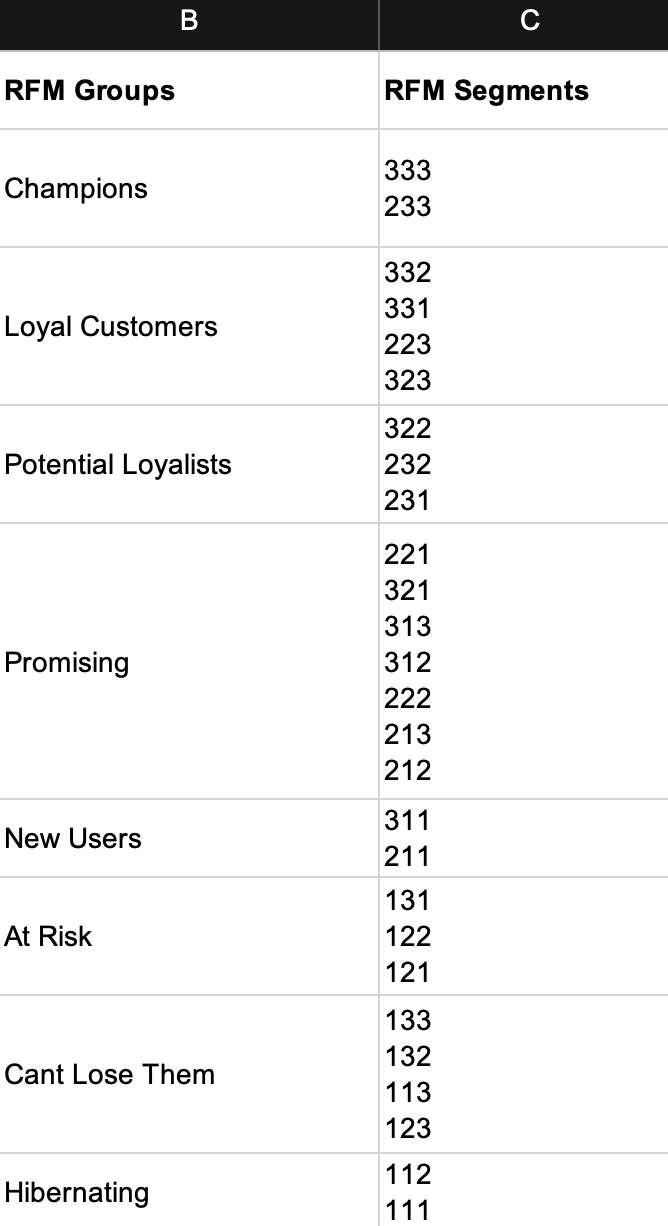
Now we have 27 segments, mapped and ready with the count. Still, it’s too many to take any actions. So we need to group them in actionable buckets to make it easier.
Step 4: RFM Groups
While grouping RFM segments, real insights start emerging.
While creating RFM groups –
- Be ruthless with count of groups you can handle. Every group should be an actionable entity. So don’t go overboard with creating too many groups.
- Count of users eventually ending up in group is very important. Don’t spread yourself thin. So any group with less than 1% of audience should be ignore or merged with other groups.
- Naming groups is a creative process, so for your best audience of RFM 333, you can use champions, soulmate, fan etc. For RFM 111 you can use breakup, lost, at risk. Tools / Brands have taken full liberty with naming. So don’t worry about following RFM groups.
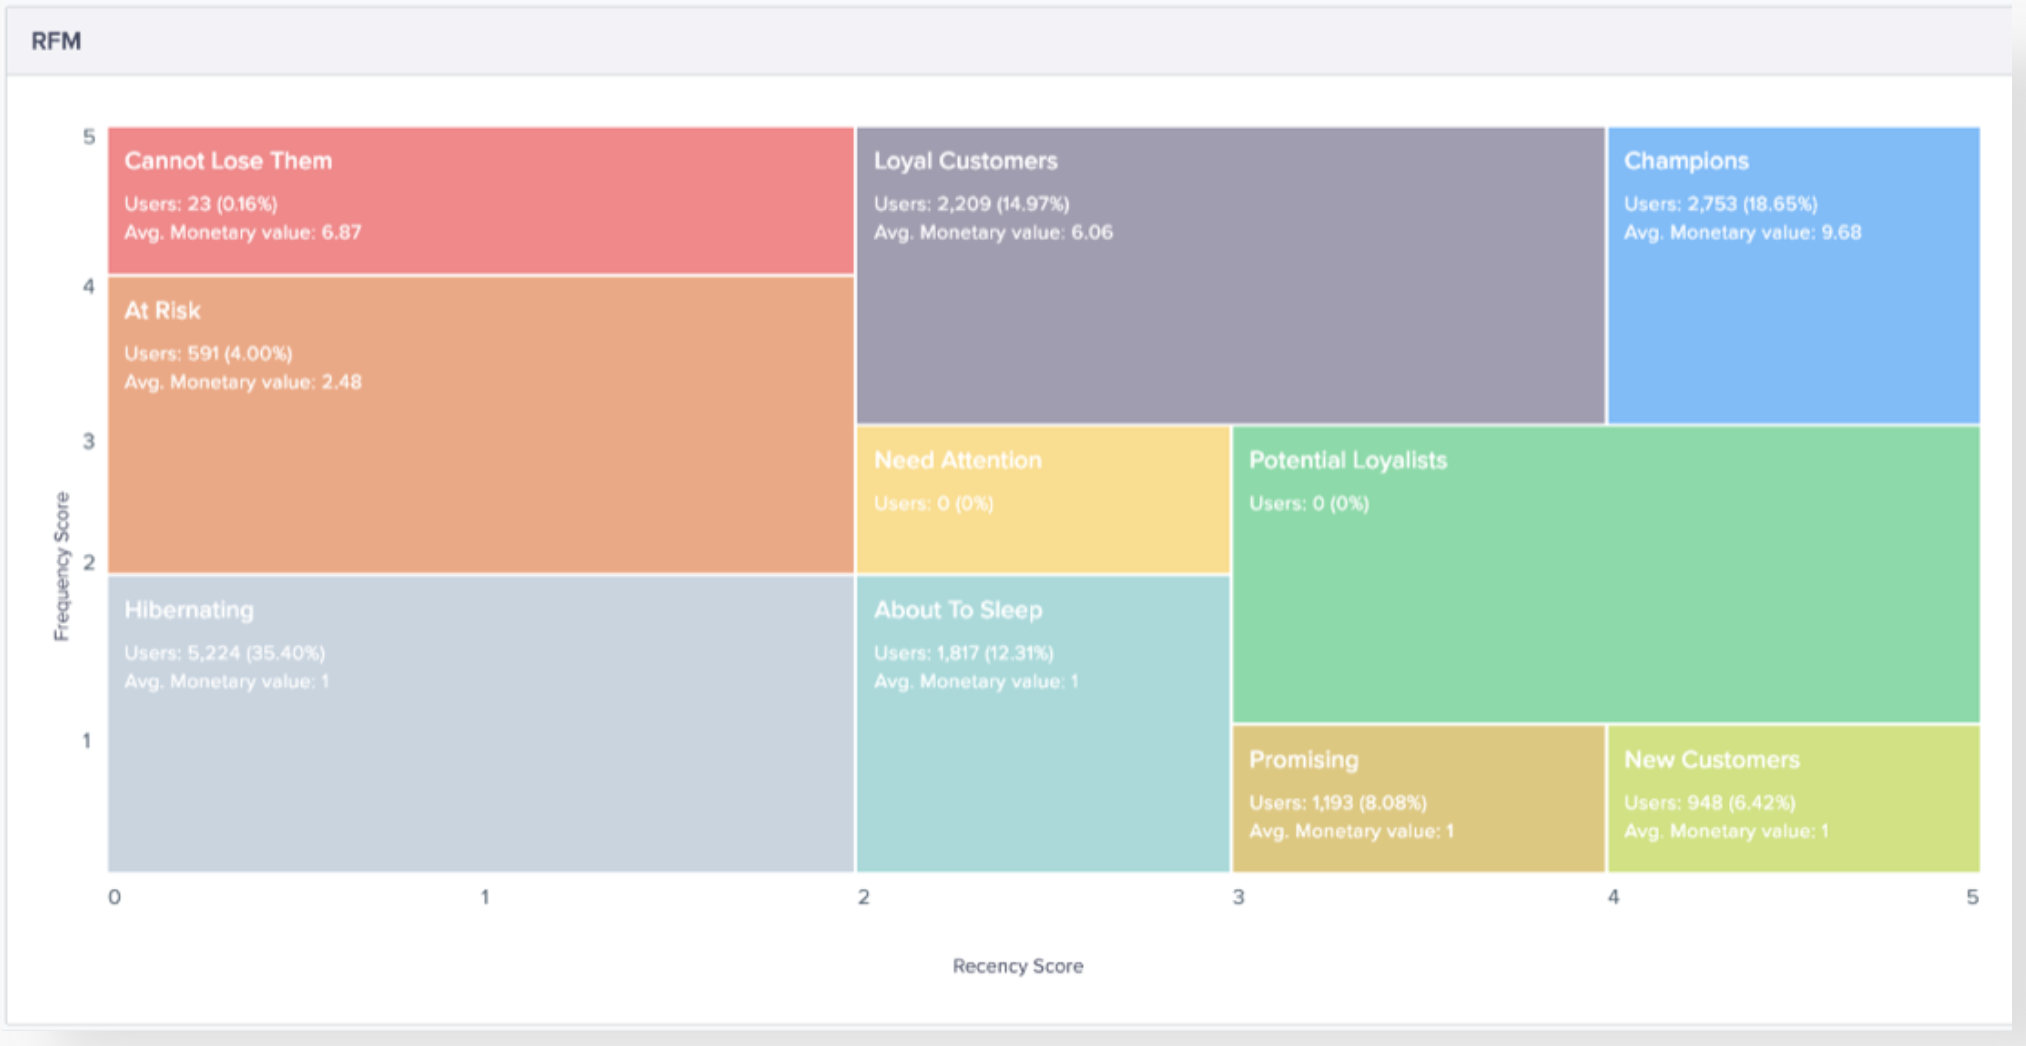
| RFM Groups | Group Definition | Score |
| Champions | Your Best Customer | 333 |
| Loyal Customers | Can become best, either stopping on revenue, or frequency. But they like you. | 323 |
| Potential Loyalists | Need more convincing. Can become loyal. | 232 |
| Promising | Showing interest in brand / product with either repeat purchase or good ticket size. | 313 |
| New Users | Recently Bought Low Ticket | 311 |
| At Risk | Repeat Buyers Long Time Ago. | 131 |
| Cant Lose Them | Former Power Users, High Ticket One Timers. | 133 |
| Hibernating | Long Ago One Time Buyers | 112 |
While using excel, it will look something like –
While using tools like OmniConvert, you can create something like –
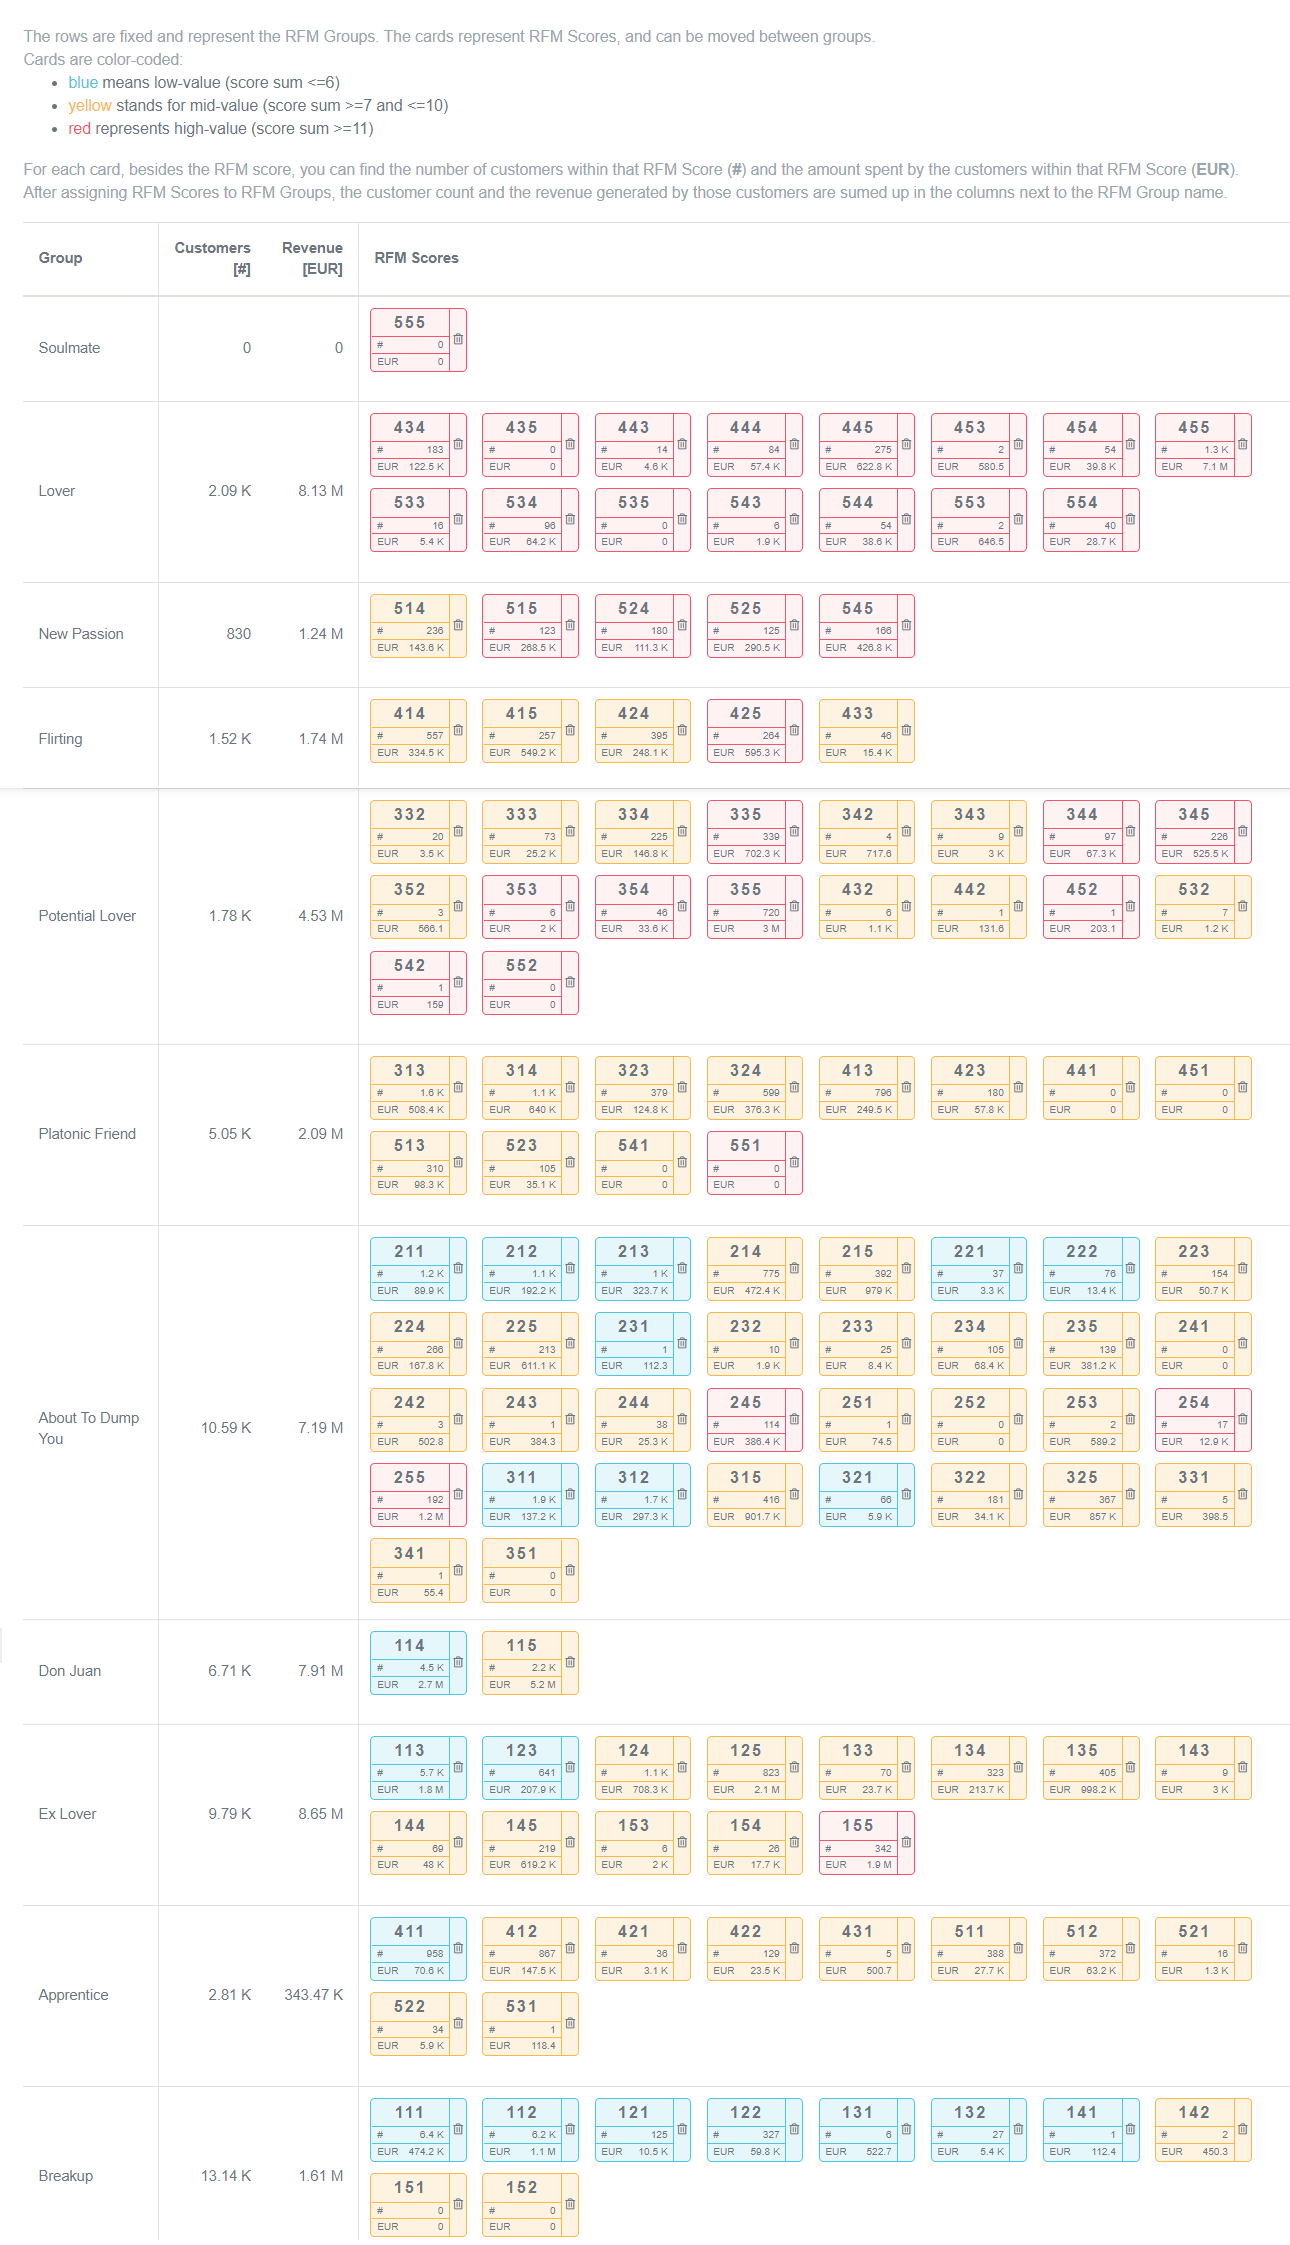
You can also fancy them in a grid, but that doesn’t show the complete picture as it takes only frequency and recency on the timeline.
Some cool RFM segments –
- 115 – One time high ticket long time ago.
- 551 – Repeat buyers but they buy low ticket repeatedly.
Step 5: RFM Actionable Analysis
The fifth step actually goes beyond the RFM segmentation itself, creating insights, analytics, messaging on strategies.
Not only you can create a communication plan but can go further with deep analysis around buying patterns, categories, product returns rate, interviews, customer support etc.
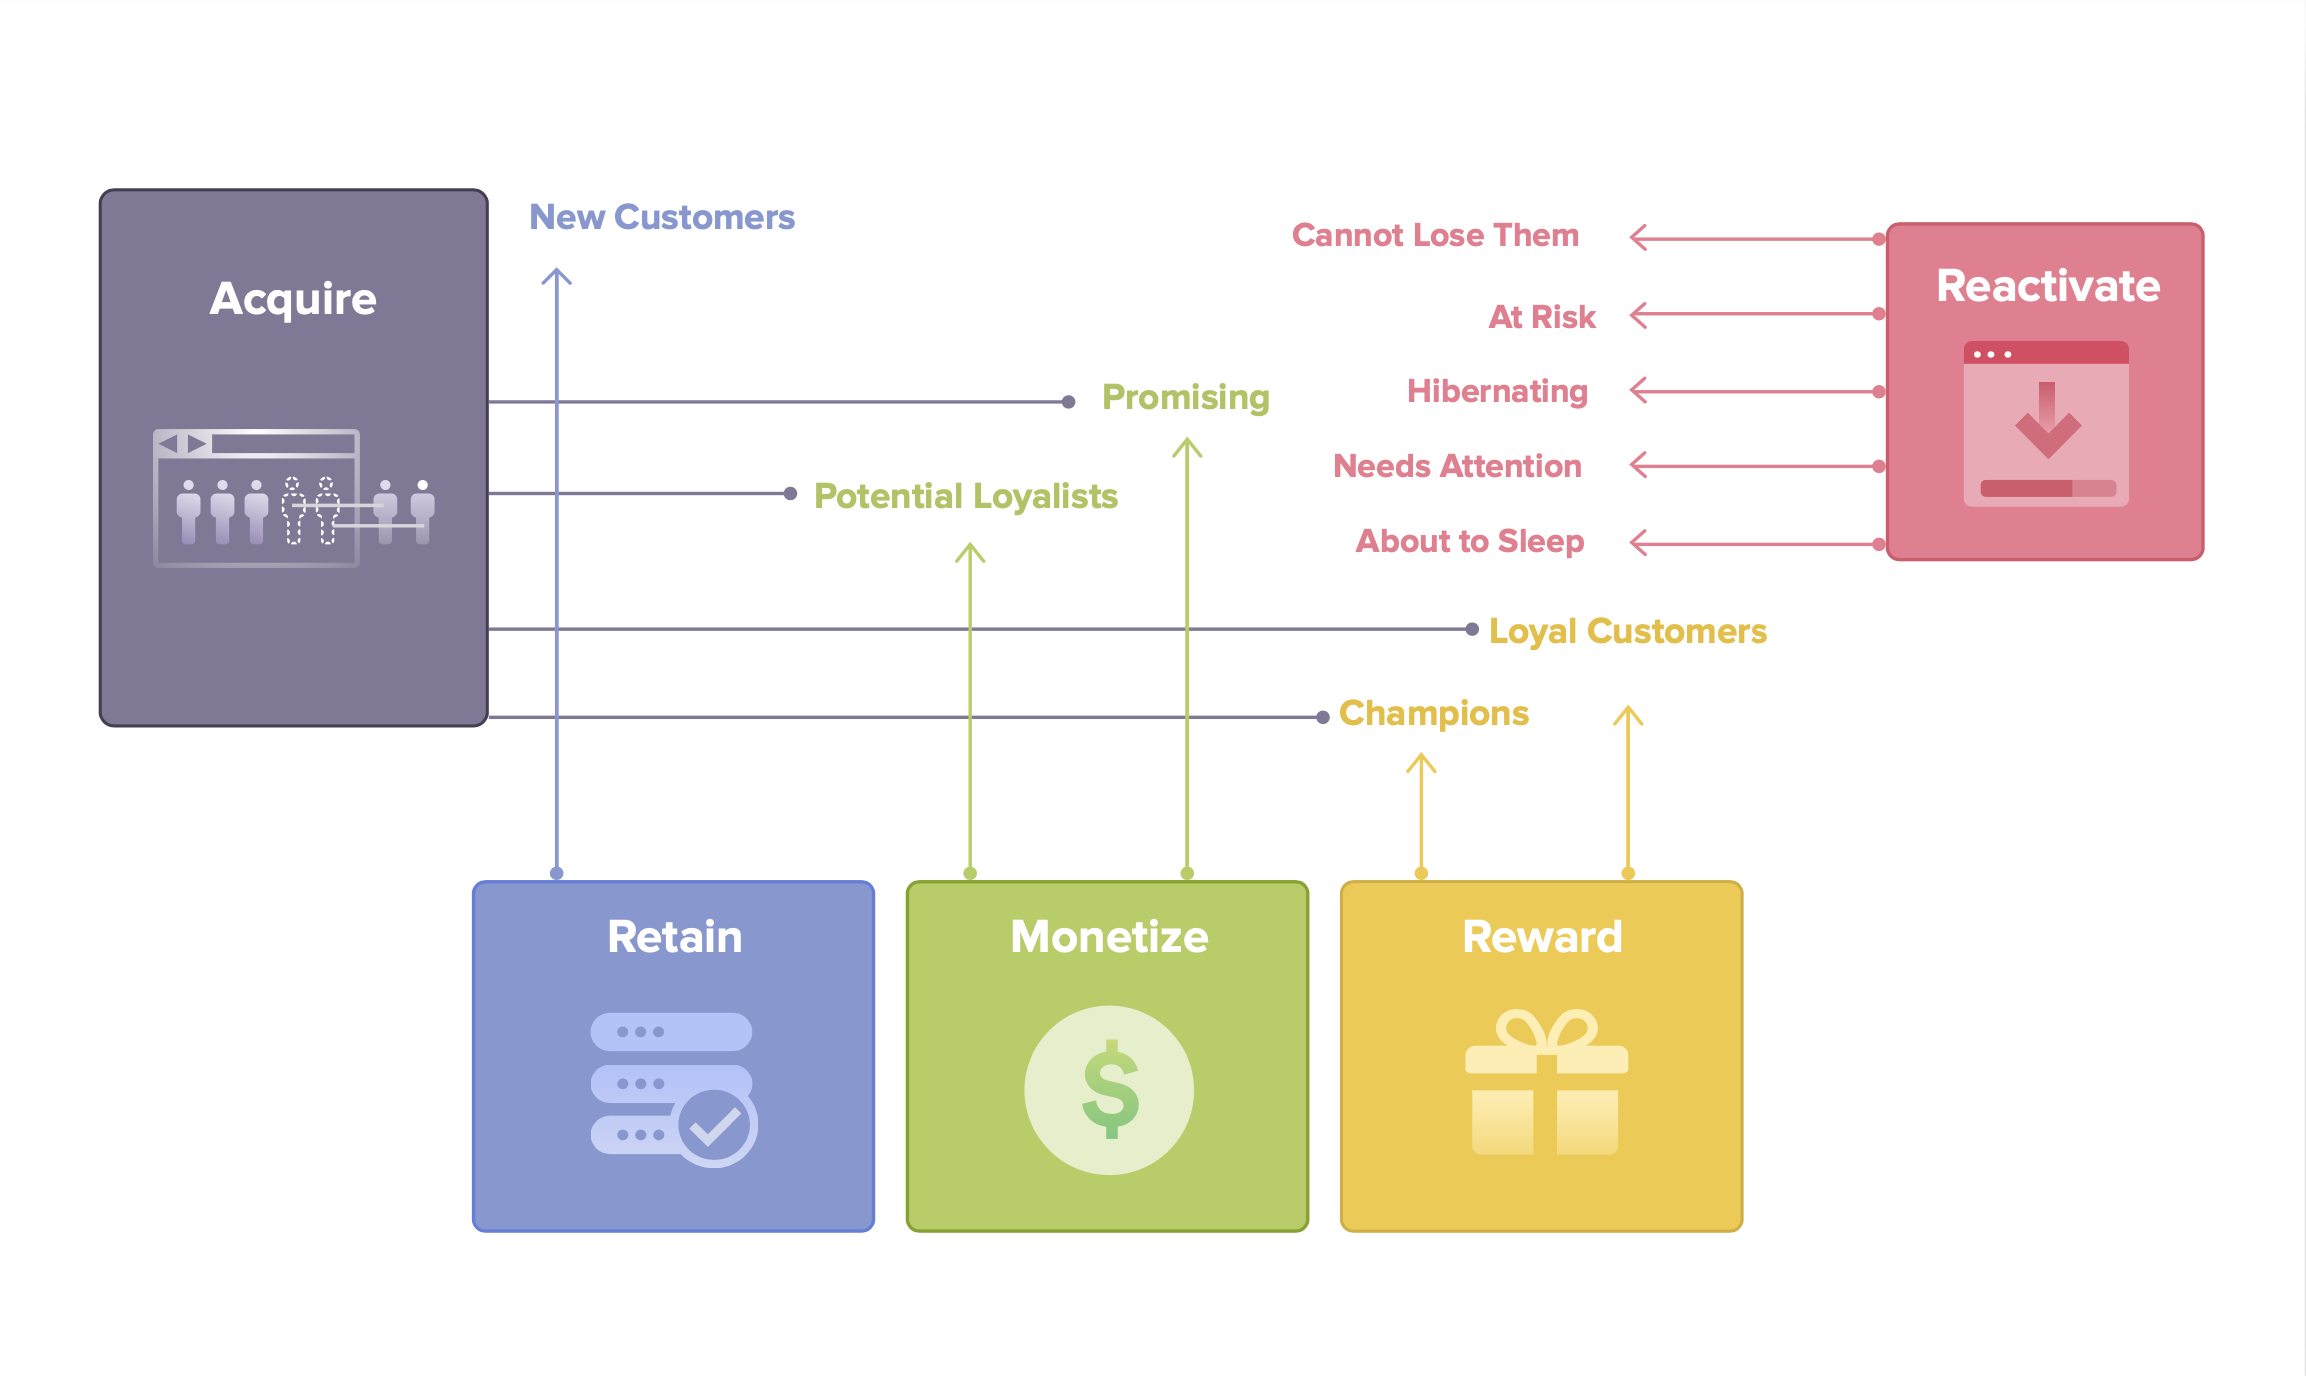
Broadly on a strategic level, we are looking to do the following –
Acquire –
- More customer like our best customers and loyal customers.
- Get more word of mouth marketing from loyal customers
Reward –
- Best and Loyal customers for their loyalty.
Monetize –
- Potential loyalist and promising customers.
Retain –
- New customers and promising customers.
- Reactivate using automations
- At Risk, Hibernating, Can’t Lose Them customers.
Variations Of RFM Model
The RFM model in email marketing for ecommerce brands helps identify and target customers effectively.
Variations include:
Traditional RFM
Segments of customers based on Recency (last purchase), Frequency (number of purchases), and Monetary (total spend).
Example: Send a “We Miss You” email to customers who haven’t shopped in the last 90 days.
RFMT
Adds Time (time since last purchase) to RFM. It’s useful for seasonal businesses.
Example: Promoting winter coats to customers who bought them last year at the same time.
RFMA
Adds Advocacy (customer reviews or referrals) to RFM. Use it to reward loyal customers and encourage referrals.
Example: Offering discounts to customers who referred friends.
These variations tailor email strategies for different customer behaviors, boosting engagement and sales.
Limitations of RFM analysis
RFM analysis is a valuable tool for understanding customer behavior in marketing, but it has some limitations:
Ignores Demographics
RFM solely relies on transaction data and doesn’t consider customer demographics, limiting the understanding of why customers make purchases.
Static Data
It’s based on historical data, so changes in customer behavior or preferences may not be reflected accurately.
Lack of Context
RFM doesn’t provide insights into the “why” behind customer actions, making it challenging to create truly personalized marketing strategies.
Overlooks Multi-Channel Behavior
It doesn’t account for customers who engage with the brand through multiple channels, missing out on their complete interaction history.
Segmentation Complexity
Determining the right RFM score cutoffs and segments can be complex and arbitrary, potentially leading to misinterpretations and ineffective marketing efforts.
RFM analysis is a useful starting point, but it should be combined with other data and analytical tools for a more comprehensive understanding of customer behavior.
Conclusion
Mastering RFM analysis in Excel without the need for extra tools is a valuable skill for businesses looking to understand and engage their customers more effectively.
This cost-effective approach allows companies, big or small, to leverage their existing resources.
By segmenting customers based on Recency, Frequency, and Monetary factors, businesses can tailor their marketing strategies to target specific customer groups, boost sales, and enhance customer satisfaction.
With Excel as a capable tool, it’s accessible to most businesses, offering a budget-friendly way to harness the power of data-driven decision-making and customer relationship management.