

With 6 billion unique email addresses on the planet, email still has the highest reach of any other mode of communication.
Email marketing audit is all about doing it right and finding actionable.
We will be covering 40+ email audit parameters to check in any email account.
Let’s get started.
Given the long history of email marketing, there are a lot of moving dimensions. Sometimes you can lose sight of some. An email marketing audit will help you discover those.
Doing an email audit is a great way to get –
- Review of current numbers and benchmarks
- Actionable list to improve the current situation
Goal Of Email Audit
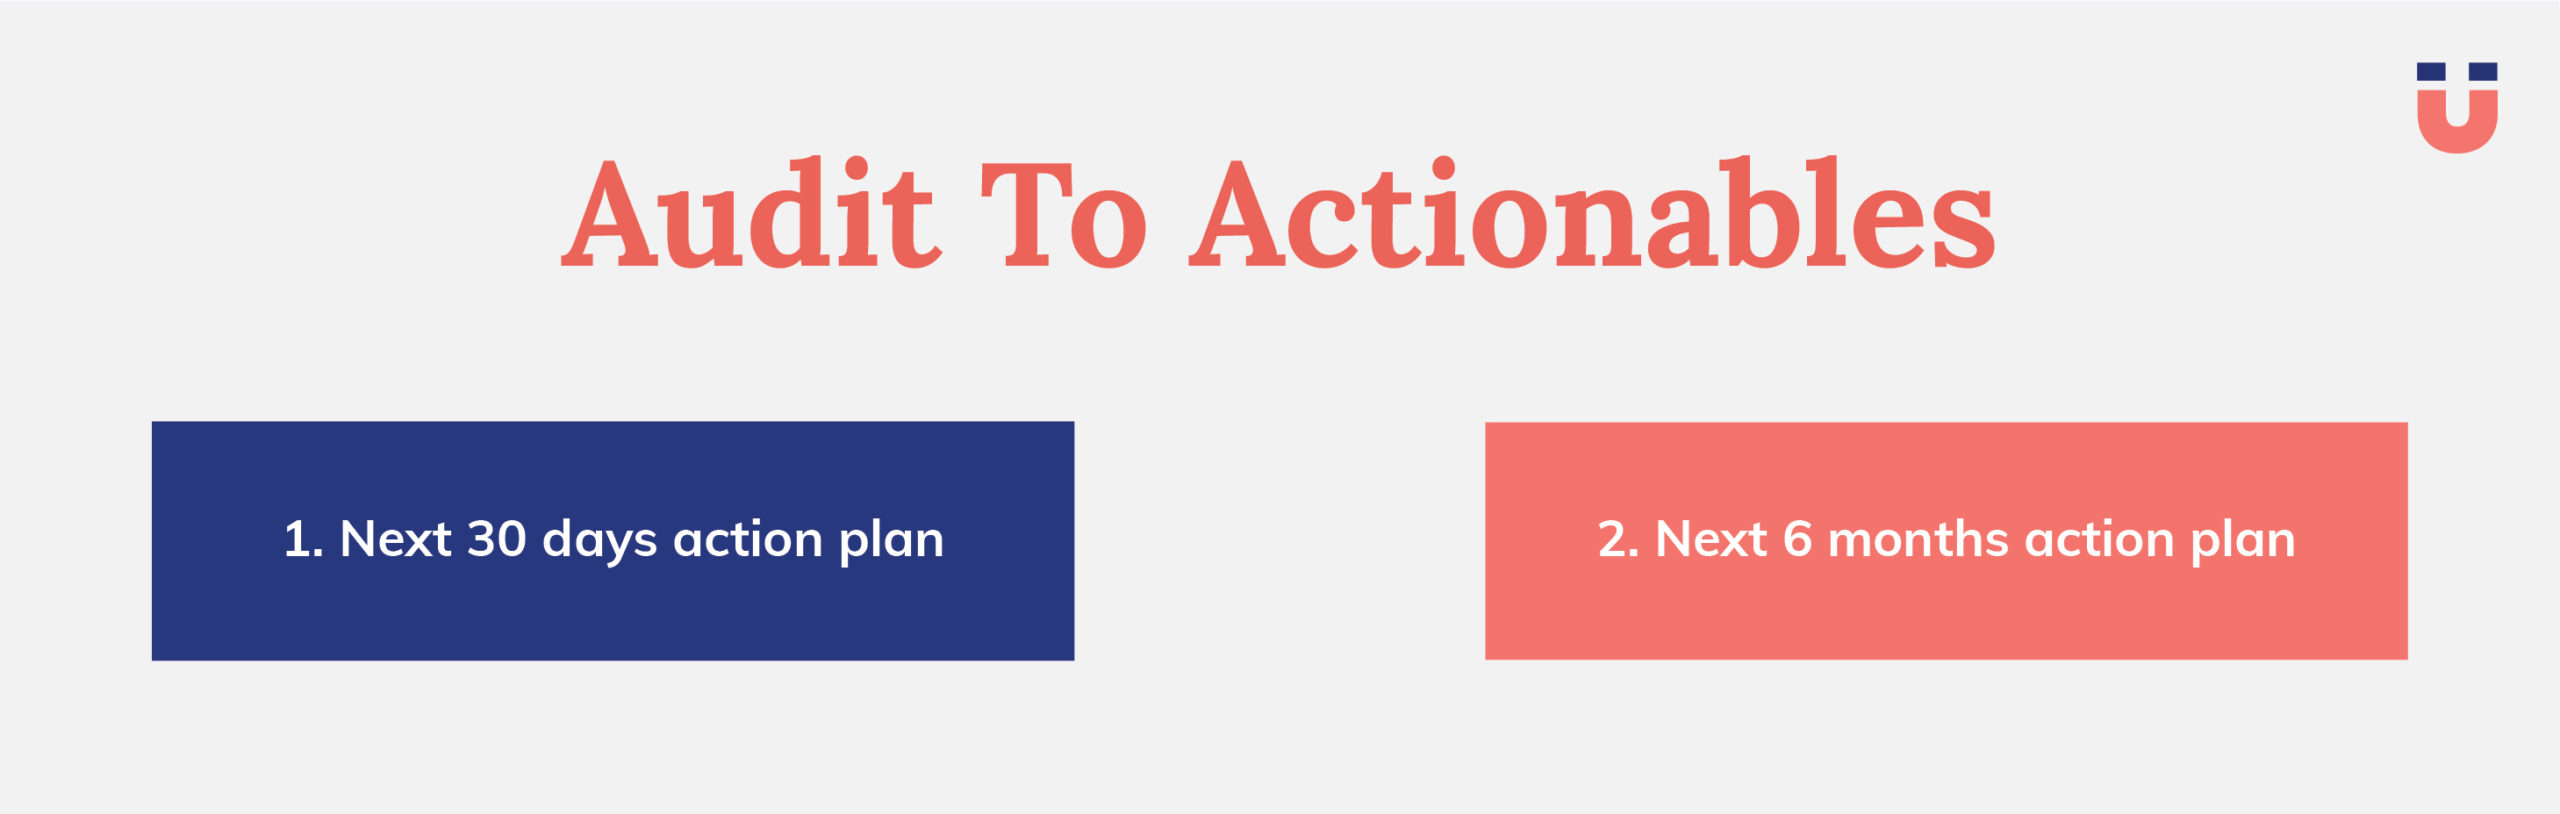
In process of email audit, you might stumble upon the following results –
- Low hanging fruits, things which can be fixed within the next 30 days on the account
- Long-term tasks, things which might need the next 3-6 months for fixing
Either way, you will get more out of the account and improve your numbers by doing audits.
Email Audit Overview
Email Audit Frequency
Recommended frequency is at least once a quarter at least to stay top of things.
Word of advice – You should only go for the email audit once you have a running account and some data into it. Otherwise, it will be better to get a rollout plan before going for email audit.
Email Audit Process
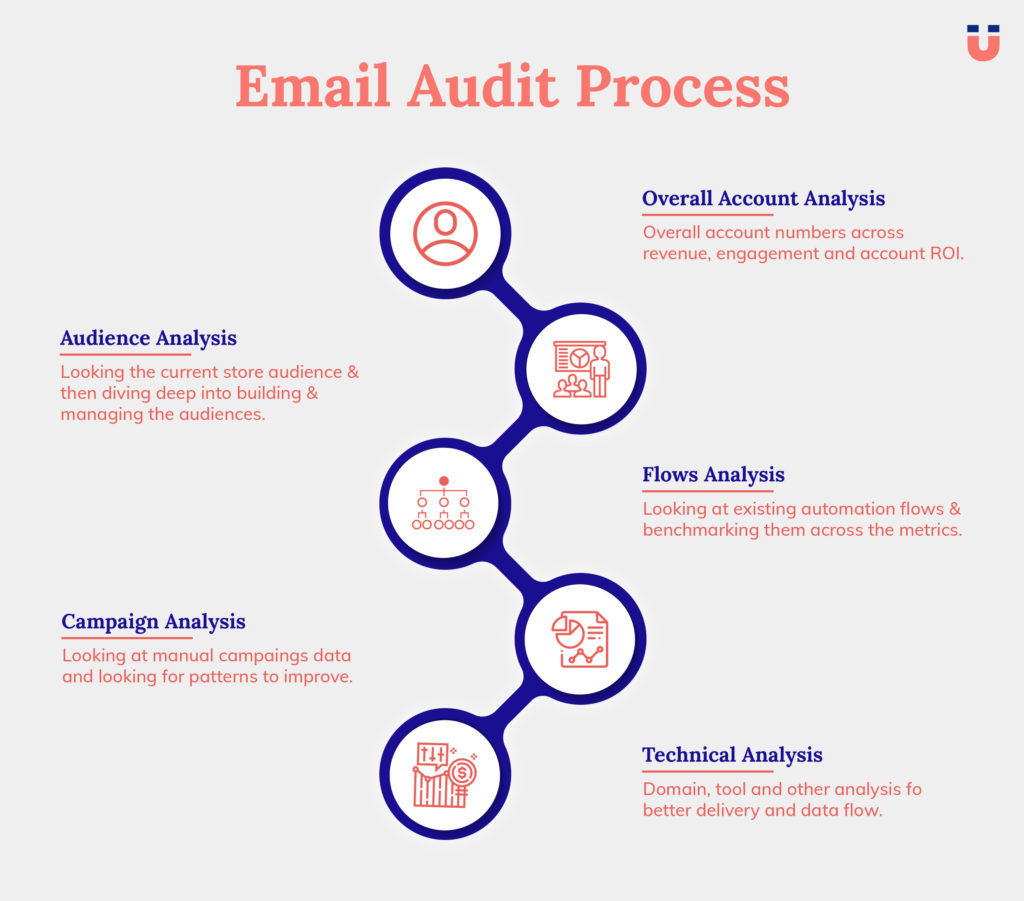
To do a complete email audit, we should start looking at the following
- Overall Account Analysis
- Overall account numbers across revenue, engagement, and account ROI.
- Audience Analysis
- Look at the current store audience and then dive deep into building and managing the audiences.
- Flows Analysis
- Look at the existing automation flows and benchmark them across the metrics.
- Campaign Analysis
- Look at the manual campaign data and look for patterns to improve.
- Technical Analysis
- Domain, tool, and other analysis for better delivery and data flow.
You can do it in any order you wish, but would recommend starting with overall and then do the audience analysis.
Rest can be done in any order.
Email Audit also involves three steps across the above areas
- Finding the current numbers.
- Benchmark those numbers to know if they are good or bad.
- Finding ideas to fix those numbers.
I will be showcasing the list of metrics to look at, some benchmarks, and lots of ideas to fix your numbers.
Overall Account Analysis
An account overview provides the starting point of an email audit. By overview, we are able to get a basic understanding of account health.
Metric Duration
Metrics can be taken across 30 days, 90 days, and 180 days or 365 days depending on the account history, seasonality, industry.
Rule of thumb: Generally look at 30 and 90 days and if patterns match, just leave it at that. Otherwise, go deep.
Metric Trends
For showcasing trends, we need to do the quarter-on-quarter performance comparison.
Revenue Analysis
We start with the most important metric – revenue.
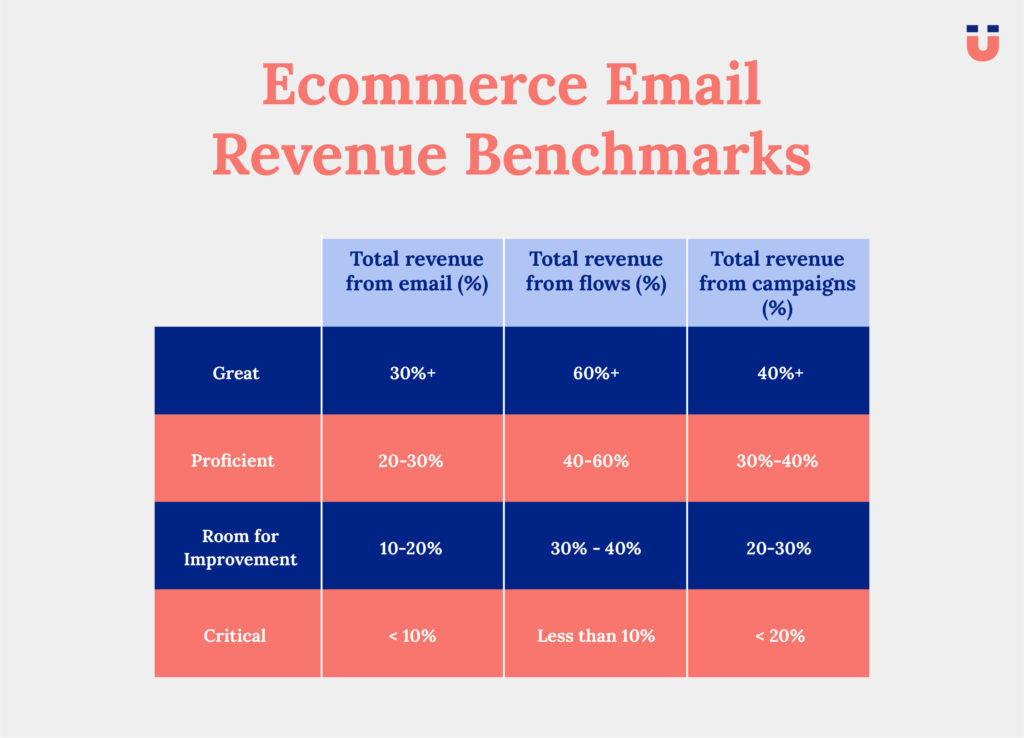
- Total Revenue % From Email (Total Revenue from Email Vs Total Revenue)
- Great – 30%+
- Proficient – 20-30%
- Room for Improvement – 10-20%
- Critical – < 10%
2. Total Revenue % From Flows of Total Revenue From Email
- Great – 60%+
- Proficient – 40-60%
- Room for Improvement – 30% – 40%
- Critical – Less than 10%
3. Total Revenue % From Campaigns of Total Revenue From Email
- Great – 40%+
- Proficient – 30%-40%
- Room for Improvement – 20-30%
- Critical < 20%
Engagement Analysis
Metrics for engagement
- Unique Open Rate
- Unique Click Rate
- Bounce Rate
- Unsubscribe Rate
- Spam Rate
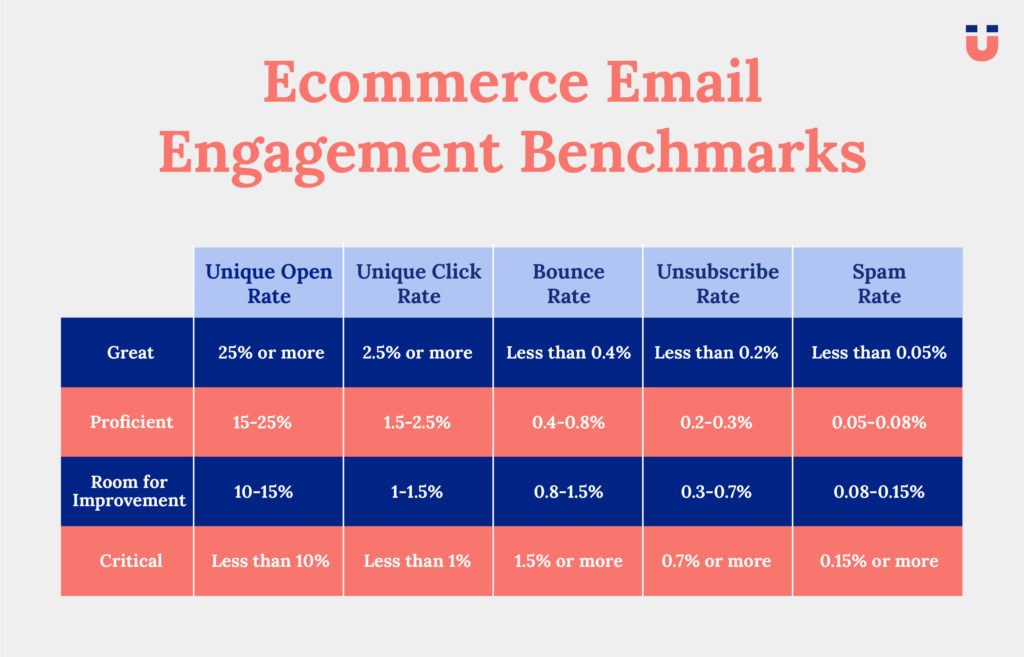
Engagement metrics are also dependent on the location and type of industry
Email Marketing ROI Analysis
ROI on the email marketing effort includes both the tool cost and team/agency cost managing the tool.
ROI on the email marketing effort includes both the tool cost and team/agency cost managing the tool.
Tool ROI –
For finding the tool costs,
Tool ROI = Total Tool Cost / Total Revenue From Email
General benchmarks –
- Median benchmark across Klaviyo is $1:$14.04
- Depends on the order size.
In the end, you should have for every $1 spent on a tool, they get back $X in return.
Email Audit Audience Analysis
For starting the audit, after overall account metrics, you can start from any of the modules. I prefer starting from segments analysis which leads to major insights in the shortest period of time.
Segments and audience analysis give an excellent overview of account audience and brand numbers.
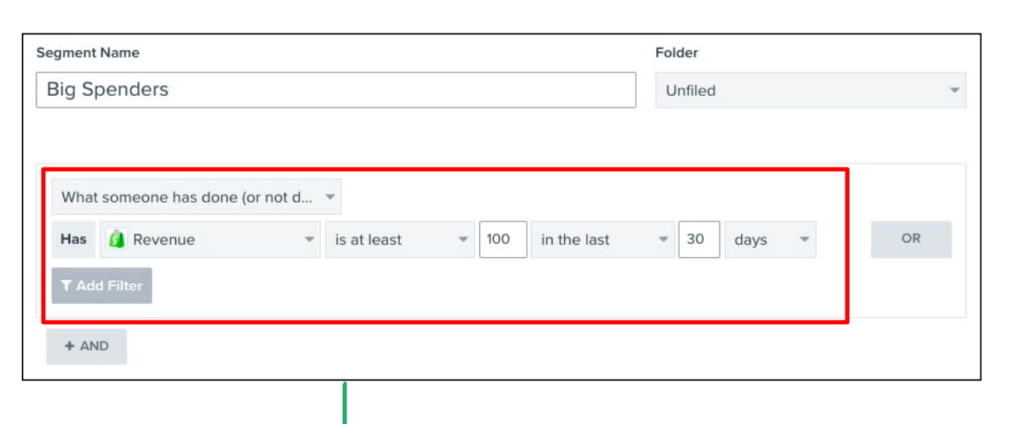
Customer Segments Analysis
Before working on anything we need to see where the current audience stands in the account.
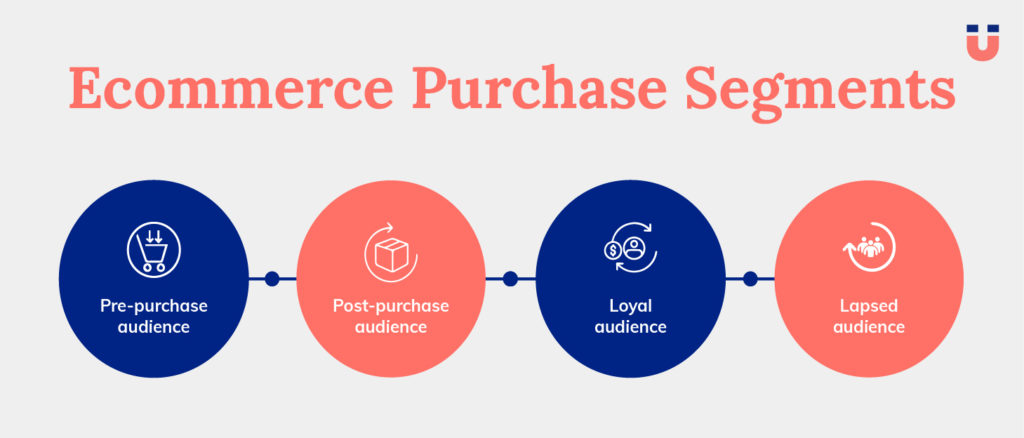
Purchase Segments
Purchase segments tell us where the customer stands in their current customer journey. For aligning with automation, we divide them into 4 groups
1.Pre-purchase audience
- Never purchased audience
- Viewed product but never purchased
- Add to cart but never purchased
- Started checkout but never purchased
2.Post-purchase audience
- All Buyers. Purchase once in their lifetime.
- Purchased in last 30 days
- Purchased in last 90 days
3.Loyal audience
- 2X Buyer. Purchased 2 or more times in their lifetime
- 3X Buyers. Purchased 3 or more times in their lifetime
- 5X Buyers. Purchased 5 or more times in their lifetime
- 2X Buyers in the last 90 days. Purchased more than 2 times in the last 90 days
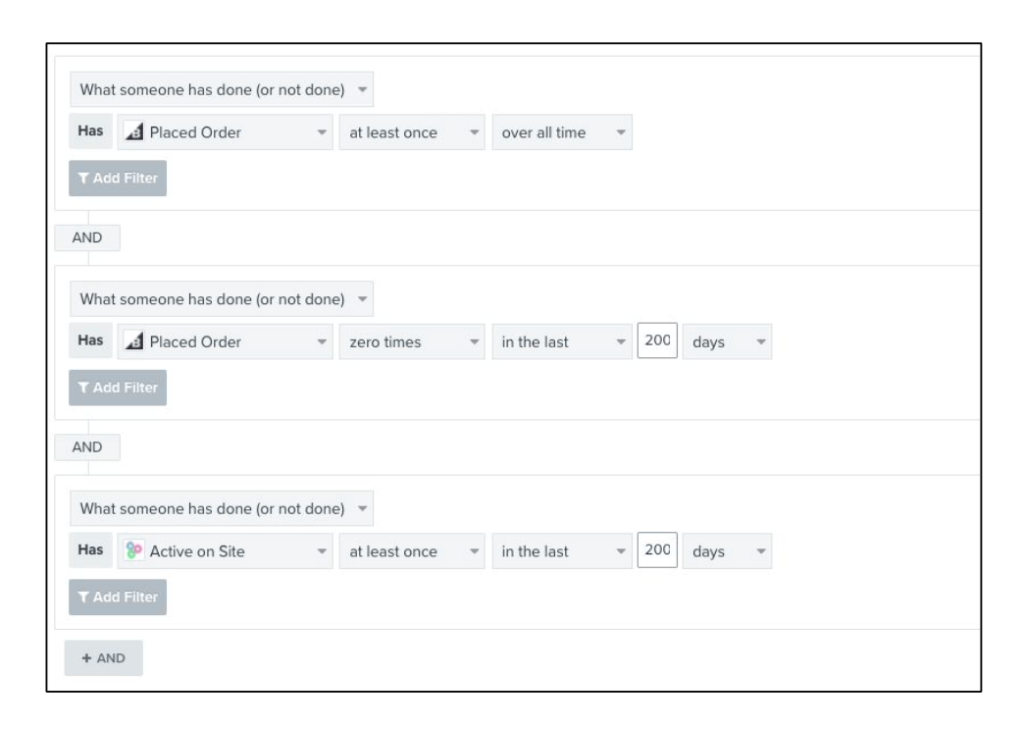
4.Lapsed audience
- 1X Buyers. Purchased only once but never purchased again
- 1X Buyers in the last 90 days. Purchased only once buyer but not since in last 90 days
- Repeat Buyers Lapsed. Purchase 2 or more times in the past but not purchased in the last 90 days
Engagement Segments
Engagement across the multiple metrics like open rate, click rate, etc.
- Engaged in last 30 days.
- Open or clicked any communication in last 30 days.
- Visited the website in last 30 days.
- Engaged in last 90 days
- Open or clicked any communication in last 90 days.
- Visited the website in last 90 days.
Category Segments
To see for the category level bifurcation of the non-buyers, buyers, and repeat buyers across multiple categories.
We look at the following for each category (Or for large stores, we can see for 4-5 main categories)
- Visited the category, viewed the category never bought
- Added to the cart of category product but never bought
- One-time buyer of category
- Two-time buyers or more of category
- Lapsed buyer of the category
Recency
Frequency
Monetary
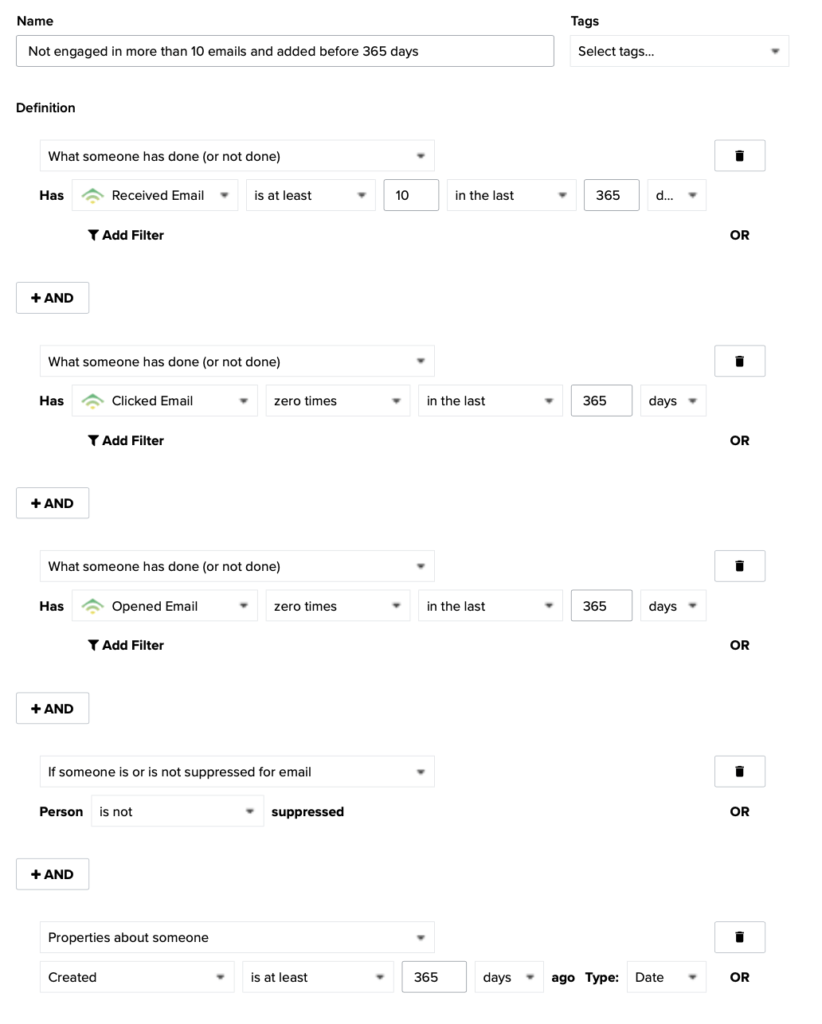
List Health Analysis
Ideally, lists should be kept to a minimum. Only create a list if absolutely needs to.
Once we decide on the main list to keep and grow. We need to check for the following –
- All list-building activities (mostly) should be targeted to this list.
- Any user adding to the system should be visible in this list. (The only exception is some special list you want to grow like buyers, wholesalers, etc.)
- Any API should be adding subscribers to this master list either on ecommerce platforms like Shopify or list building tools like JustUno, Privy
2. Analyze the list engagement metrics like
- How many people are sent emails on the list in the last 30 days
- How many people are engaged in the list
- List growth rate
- List-unsubscribe rate
Start with checking the existing suppressed lists in the account. Common reasons for suppressions are:
- Unsubscribed by the customer
- Marked spam by the customer
- Email bounced
- Manual suppressions
By looking at the above data, we can have a look at the following patterns
- The high number of unsubscribes or marked as spam can showcase unethical email sending practices done on the account.
- High count of email bounced can be due to purchased or old data being used on the account.
- High count of manual suppression might be due to wrong data syncing or wrong import.
All the suppression on the account should be around 10-20% of the total audience. Anything more than that needs further analysis.
For effective list building, we need to focus on the following-
1.% of new subscribers per month Vs total new visits on the website.
- This tells us about the subscribers captured from the visitors on the website.
- Count of new subscribers per month.
- Count of unsubscribes per month.
- Depends on the volume of emails sent to the user.
Most ecommerce platforms have some sort of list building already in the basic template.
Check for the data flow between the tool and the existing list building. Common areas to check
- Footer of the website.
- Home page (Should be above the fold)
- Check out page.
- Account registration/signup page.
We need to see from where we are capturing the user information and they are coming into the account and being accounted for.
Different brands have different suppression policies. Marketing automation tool also plays the role in it.
Some marketing tools enforce it strictly where some give some leverage to the brand to set preferences.
Common preferences are like –
- If customers unsubscribe from one list, should we unsubscribe from other lists as well?
- Handling hard bounces. Most of the tools automatically move them to suppress
- Handling soft bounces which is highly different for many tools. Some tell it upfront, some keep it ambiguous
- Handling marked as spam. Most of the tools automatically move them to suppressed which is a must to keep good deliverability rates
Flow Analysis
Flows or email marketing automation are the most important part of email marketing.
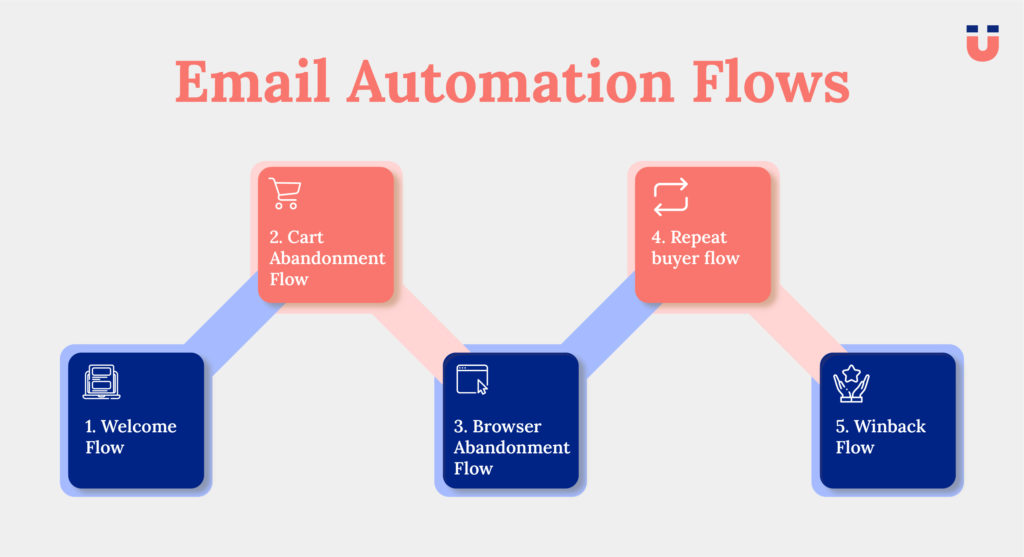
Some flows are strongly advised on any ecommerce store capturing the most important triggers and targeting the most important customer segments across the customer journey.
- Welcome Flow
- Cart Abandonment Flow
- Browser Abandonment Flow
- Repeat buyer flow
- Win-back Flow
In a nutshell, we need to have something around –
- When the customer registers/subscribes on the website. Sort of a welcome.
- When a customer has shown interest in the product. Sort of cart, browse, search.
- When customers have bought something. Sort of post purchase.
- When customers have bought something repeatedly. Sort of repeat purchase thank you flow.
- When customers have stopped buying from the store. Sort of repeat purchase.
Every brand might have custom flows depending on triggers on their store and their industry. But some are quite basic and should be in every store –
- Sending welcome flow
- Sending cart abandon series
The average revenue per recipient for abandoned cart series in Klaviyo: $5.81
The average revenue per recipient for the welcome series in Klaviyo: $3.34.
The welcome email should get the 25-30% open rate and 3% click rate.
Should include anything you promised on the pop-up. Be it welcome coupons or quiz results.
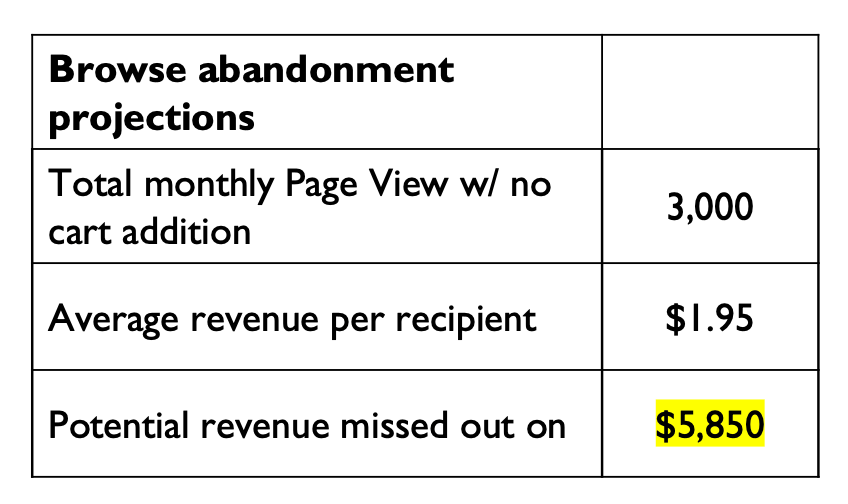
Benchmark: The average revenue per recipient for browse abandonment series in Klaviyo: $1.95
Use a post-purchase flow to upsell and cross-sell immediately after an order is placed. The best post-purchase flows promote complementary products and encourage loyalty programs.
Drew Sanocki at Karmaloop:
- 35% of Amazon’s revenue comes from up-selling and cross-selling
- “At Karmaloop, we put this into practice with post-purchase bounce back campaigns that marketed to customers who had just completed a purchase…The offers created a sense of urgency that ultimately increased the LTV of already successful customers.”
Once done with audit, check out our guide to optimize klaviyo marketing automations.
Email Marketing Campaign Analysis
The basic tenet of marketing comes to Right Message at Right Time for Right Audience. Somehow automation takes care of the at least right time and audience.
For the campaign, we need to ensure the same.
Most brands send campaigns to All Customers at 9:00 am Monday about New sales.
By looking at the past data, we can check for the performing audience
- Are they ONLY sending to a master list?
- Are you sending newsletters to more than just one segment?
Companies that regularly send to a smaller percentage of their list see better performance (higher open rates, higher click rates, higher revenue per recipient).
Campaign sending time is the most overlooked part of the campaign, which can lead to easy wins.
Common recommendations around the sending time are –
- Send on the recipient’s local time zone.
- Run A/B tests with sending time.
All email opens occur within the first hour after being sent; within the second hour, nearly 30%. After that, opens come at a much slower pace. So it’s crucial to optimize the sending time for the campaigns.
Most email opens happens during the beginning of your recipient’s weekdays or the end of the weekday.
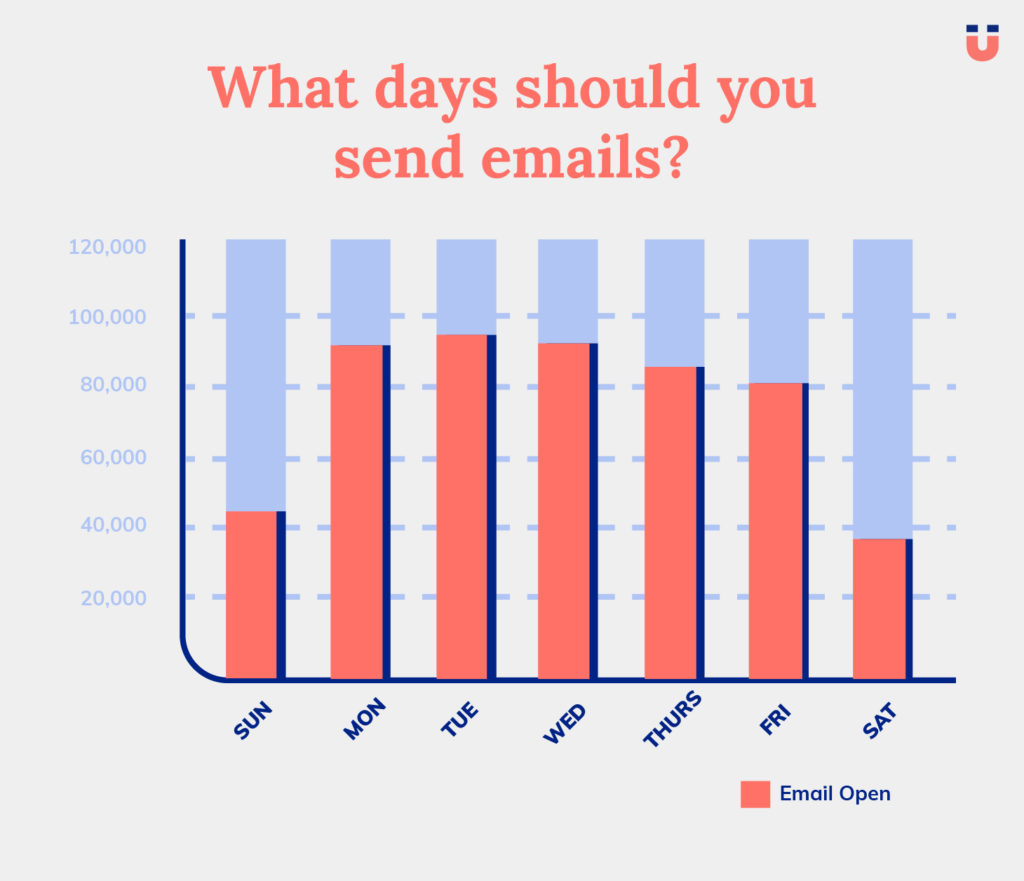
To maximize your open rates, you should be sending emails on Monday, Tuesday, and Wednesday.
Now coming to the time of the day –
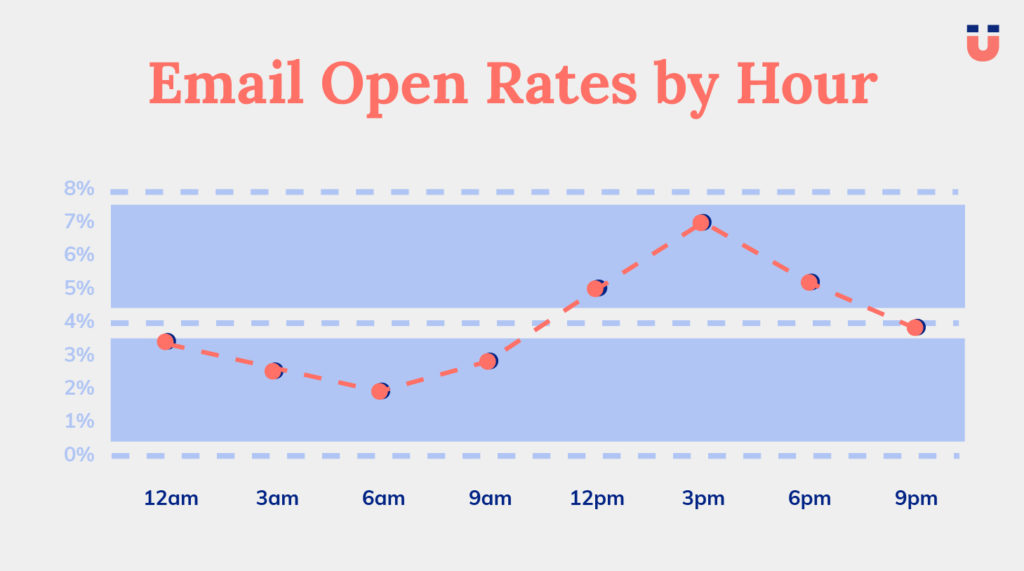
Also, open time might differ from country to country.
For more details, you can check out the open rate for other countries at Litmus
So, 3 pm is the optimal time to send the emails.
Coming again to our point of testing sending times, you can simply run an A/B test on your audience based on the sending time.
- Split the campaign audience into 3 equal parts.
2. Schedule 3 parts at different times.
- 1st at the start of the day like 9 am – 11 am
- 2nd at the mid of the day like 2 pm – 5 pm
- 3rd at the end of the day like 7 pm – 9 pm
3. Narrow down the timing in the next campaign based on performance. Supposedly, you get the best results during the start of the day, run another test at 8 am / 9 am / 10 am to narrow down on the timing.
In all timings, will give you a minimum uplift of 1-2% of open rates which is a super easy win.
For getting the right messaging, it’s always good to check out multiple hypotheses while sending. You can start with
- Subject Line A/B test
- Sending Time A/B test
- Whole Content A/B test
You’re averaging $5,000/campaign and seeing 20% open rates. If you test a few subject lines and see a 1% change in open rates, that could mean an additional $250/campaign and $1,000/month based on how often you send campaigns. Coming up with 1-2 variations of each subject line only takes a few minutes and can really pay off.
Campaign message depends on the
- Desired primary goal of the email, the main reason we are sending this campaign. The action we want the recipient to take. Editorial or advertorial.
- Someone to click on a link.
- Making a sale.
- Making someone fill out a form.
- Watch video
- Secondary goal of the email might exists like you want people to watch a video but also want to share with friends. You want to read the blog article but also want to check out the other offers running on the website.
- Avoid secondary goals if not required. Best emails are about a single goal.
- How is the email going to benefit your reader?
- Key points or bullet points you want your reader to take away from the email
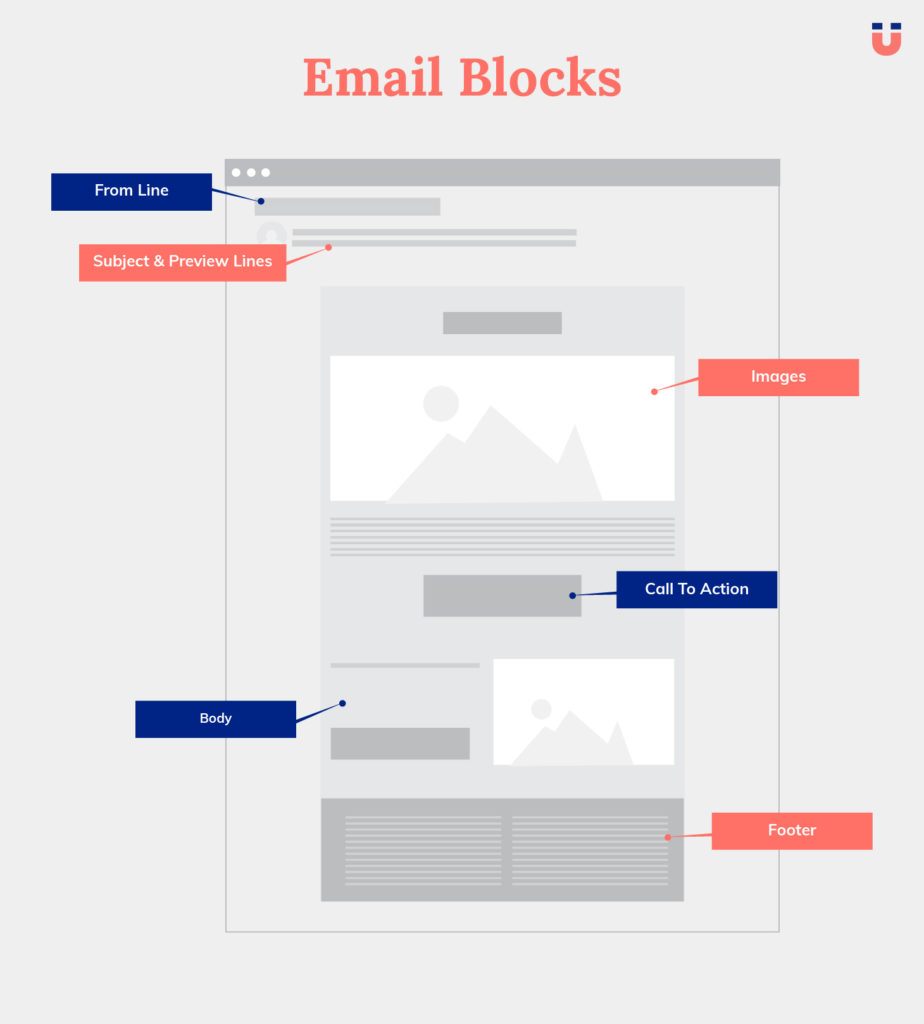
From Line
Checklist –
- Personal, professional name. (Will the recipient will recognize from name and email address?
- Company domain name.
Checklist –
- Length is between 20-40 characters
- Best performing subject lines are around 20 characters long with 4-5 words
- Check for spamming words
- Preview line exists
- If the subject line is the first line of copywriting formula, the preview is the second line.
Good to have
- Include emoticon if possible
- Built curiosity
A great tool to check subject lines – CoSchedule
Body
Design is highly subjective but still, some things are mandatory for a good email.
Checklist –
- Aligned to brand design guidelines
- Have a clear heading on the email
- No broken links and links to relevant landing pages
- Clicking on the logo takes to the home page
- Personalization is done on the body. (Name, product, or any other information we might have)
Good to have –
- Text / HTML ratio on emails. (ESPs prefer text emails to Html emails. Emails with higher text ratio have high chances of landing in inbox)
Call To Action
Checklist
- Main CTA (Call To Action) should be visible and prominent
- Text inside the call to action is urgent
Good to have
- Repeat the primary CTA at the end of the email
- Design/color theme difference between first CTA and second CTA.
Images
Checklist –
- Alt text included in the images
- Images are linked to a URL as many people click on images
- Images are compressed for quick load time.
Responsive
Checklist –
- Mobile responsive email designs
- Text readability on mobile.
Good to have –
- Avoid text / CTA over the image to get better visibility in mobile view.
Footer
Checklist –
- A physical address should be mentioned in the emails for CAN-SPAM compliance
- Unsubscribe button is obvious to find
- Contact information is provided
- Social icons (depending on the brand)(Include only active social media handles)
Email Design Analysis
Design is highly subjective but still, some things are mandatory for a good email.
- Main CTA (Call To Action) should be visible and prominent
- Mobile Responsive email designs
- Text / HTML ratio on emails. (ESPs prefer text emails to Html emails. Emails with higher text ratio have high chances of landing in inbox)
- Aligned to brand design guidelines
- Broken links or relevant landing pages
- A physical address should be mentioned in the emails for CAN-SPAM compliance
Subject & Preview Lines impact open rates.
Technical Analysis
Technical analysis might improve the overall deliverability, execution, and effectiveness of the whole account.
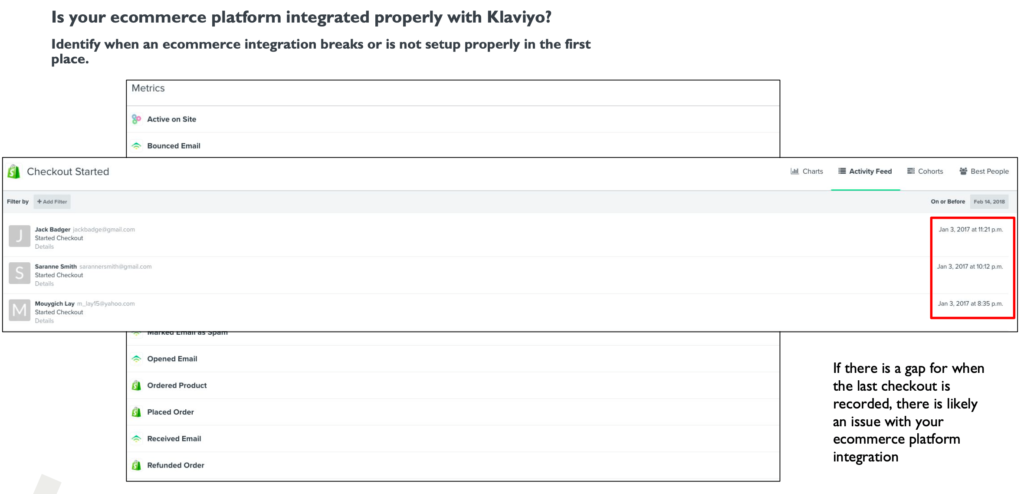
Marketing automation tool integration needs to be checked before starting the work. Look for the following data being captured and available for sending flows, segmenting an audience, etc.
- Ecommerce Events Information
- Add to cart shown on subscriber level along with product/category information
- Viewed product showing on subscriber level
- Checkout started or page view information on customer level
2. Ecommerce Order Information
- Placed Order
- Cancelled Order
- Shipped / Fulfilled Order
- Delivered (Might depend on the third party) Order
- Refund Order
3. Engagement Information
- Open rates
- Click rates
- Bounce rates
4. Feed / Catalog & Coupon Integration
- Products information like category name, images, price, name, SKU, etc. are imported into the system.
- Generate recommendations based on the category name or able to filer based on the product level information.
- Coupon generation and management.
To get the emails in the inbox, the following should be implemented on the technical level.
Domain-Level
- SPF
- DKIM
- DMARC
- Custom subdomain on the account.
Analysis
- IP Address Sender Score
- Domain-Level Reputation Monitoring (MX Records)
Other
Sending email should be mapped to a real customer id. Upload a user image on the email account as well as on the gravatar.
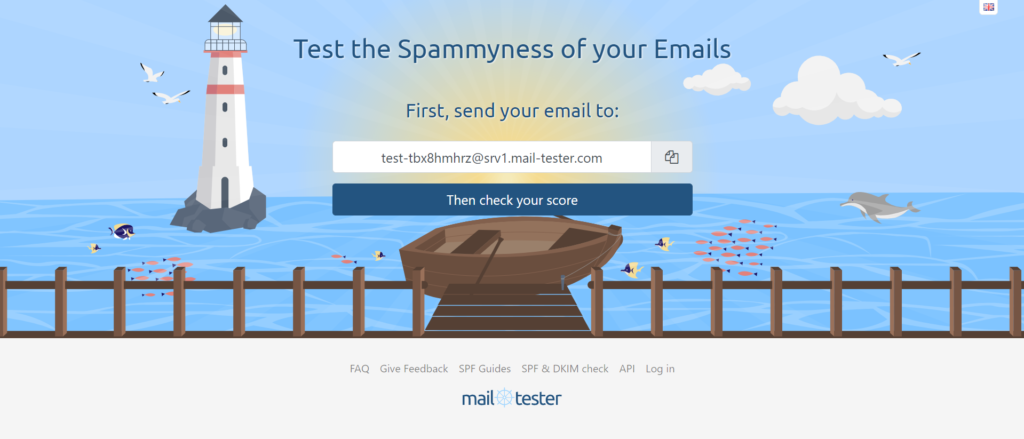
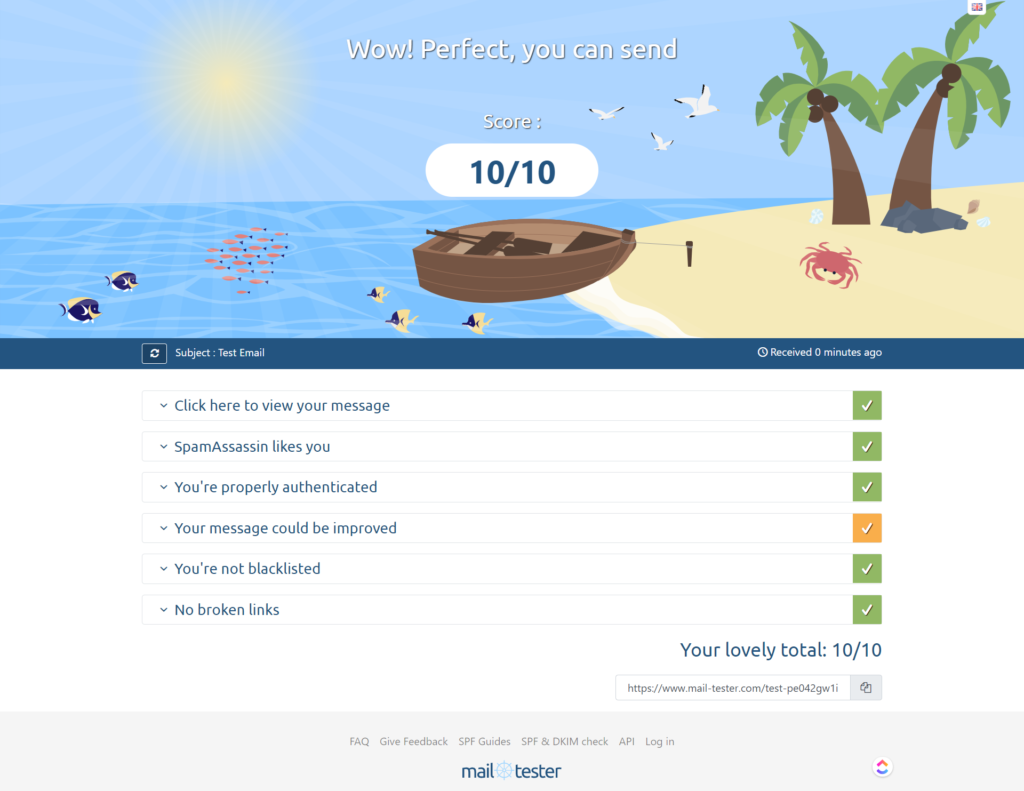
Check whether your email is going into the right inbox or in spam with Mail-tester
Tracking (UTM parameters) should be enabled on the account level
Some tools give additional benefits like Facebook audience export from the tool.
Do they have integrated with Facebook’s custom audience?
Remember – Customers are 22% more likely to purchase when they see a Facebook ad and an email on the same day.
Conclusion
The right strategy can save you 6 months of performance delay. Good strategy comes from a good email audit.
A good email audit will definitely give you a lot to process and think about. Easily actionable for the next 3-6 months.
Also, they will provide a base for monthly or quarterly reports.
Try this today
To close, suggesting some actionable to start today –
- Find revenue from email today and compare to revenue benchmarks.
- Find email engagement benchmarks and compare to engagement benchmarks.
- Make your purchase segments to know where your customer stands currently in the funnel.
3 points above will take 15 mins and give you enough to get the whole thing completed.
Let me know what worked for you and what didn’t.