Key takeaways
- An active subscriber count includes paused, skipping and failed-payment subscribers. One brand had 363 marked active that hadn’t paid since their card declined.
- On one brand, 57% of subscribers placed a second order against 14% of one-time buyers, but a subscriber’s second order is a charge they didn’t stop.
- Order-three retention and real 12-month LTV are the two subscription numbers that are hard to game, because the money has already arrived.
A founder told me last week, “We have a 43% save rate. It’s a false economy.”
Almost none of the subscribers his cancel flow saved ever paid him again.
This week I opened four subscription dashboards: Recharge, Loop, Skio and Stay AI.
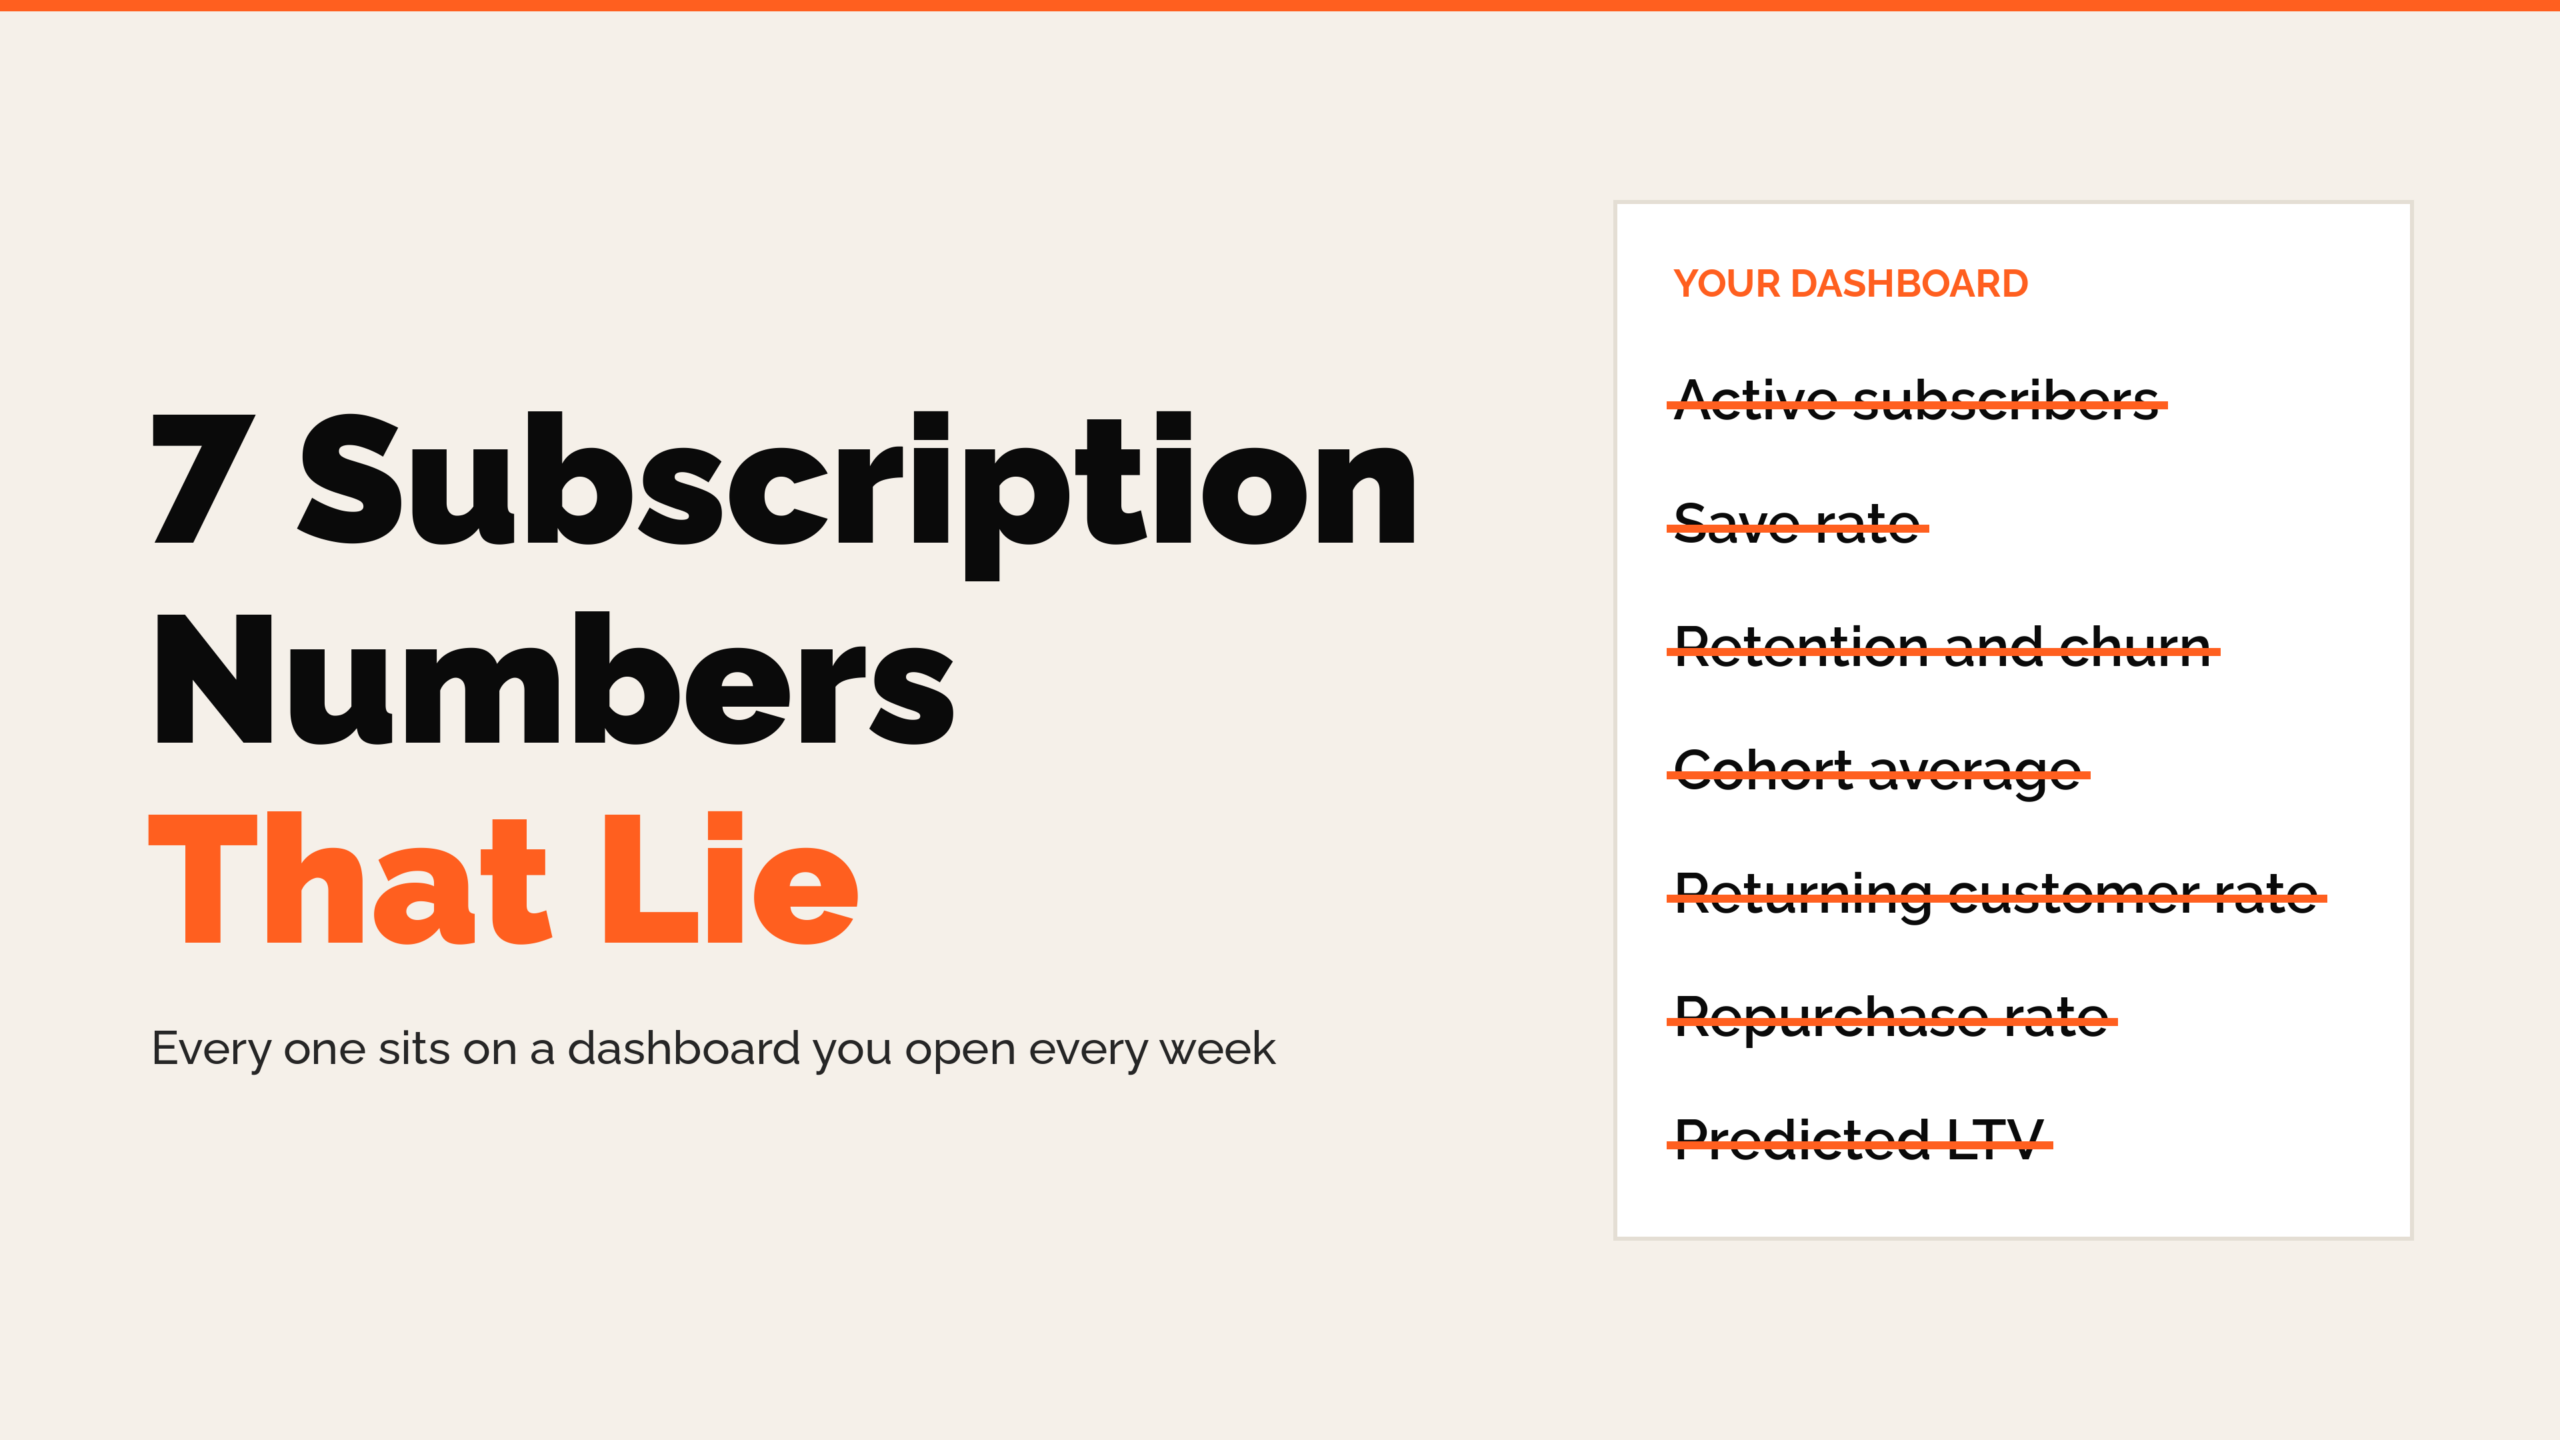
Every number on them is accurate. Most of them can go up without a single customer paying you again.
Here are seven, and what I read instead.
1. Active subscribers
Your app counts everyone who hasn’t cancelled as active.
That includes paused subscribers, people who pushed their next charge two months out, and people who skip every order.
Some of them haven’t paid you in a year. One brand had 363 still marked active that hadn’t paid since their card declined.
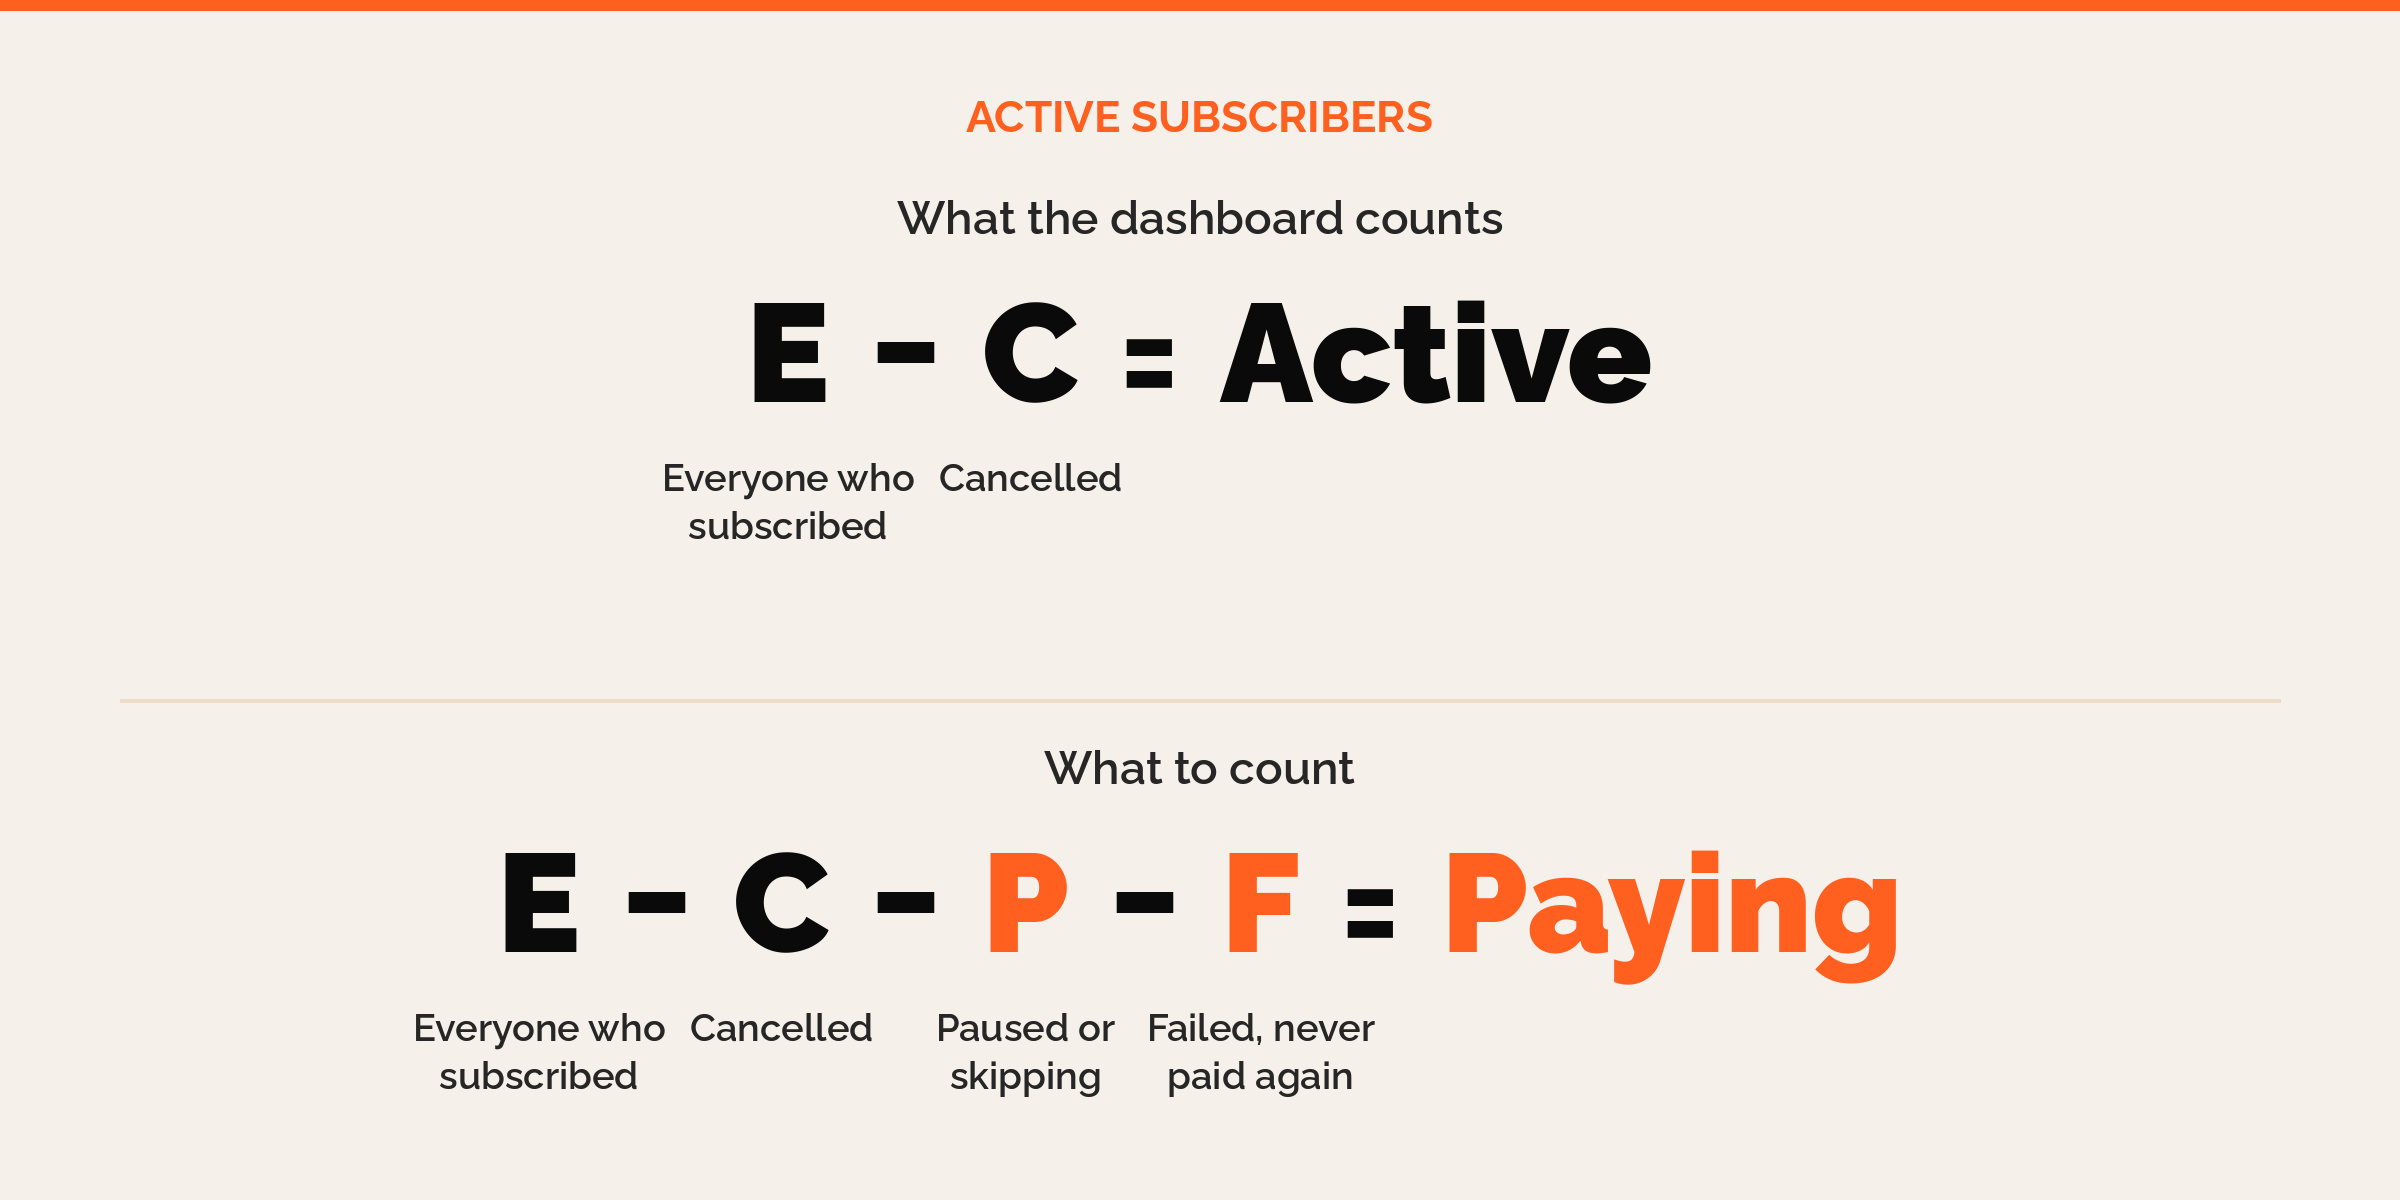
Read instead: subscribers who paid in the last billing cycle.
2. Save rate
Your cancel flow counts anyone who didn’t cancel today as saved.
That includes the subscriber who skips the next three orders, and the one who pauses with no end date.
Neither has paid you since.
Read instead: subscribers still paying 60 days after the save.
3. Retention and churn rate
Most tools work it out like this. Churn is the same number upside down.
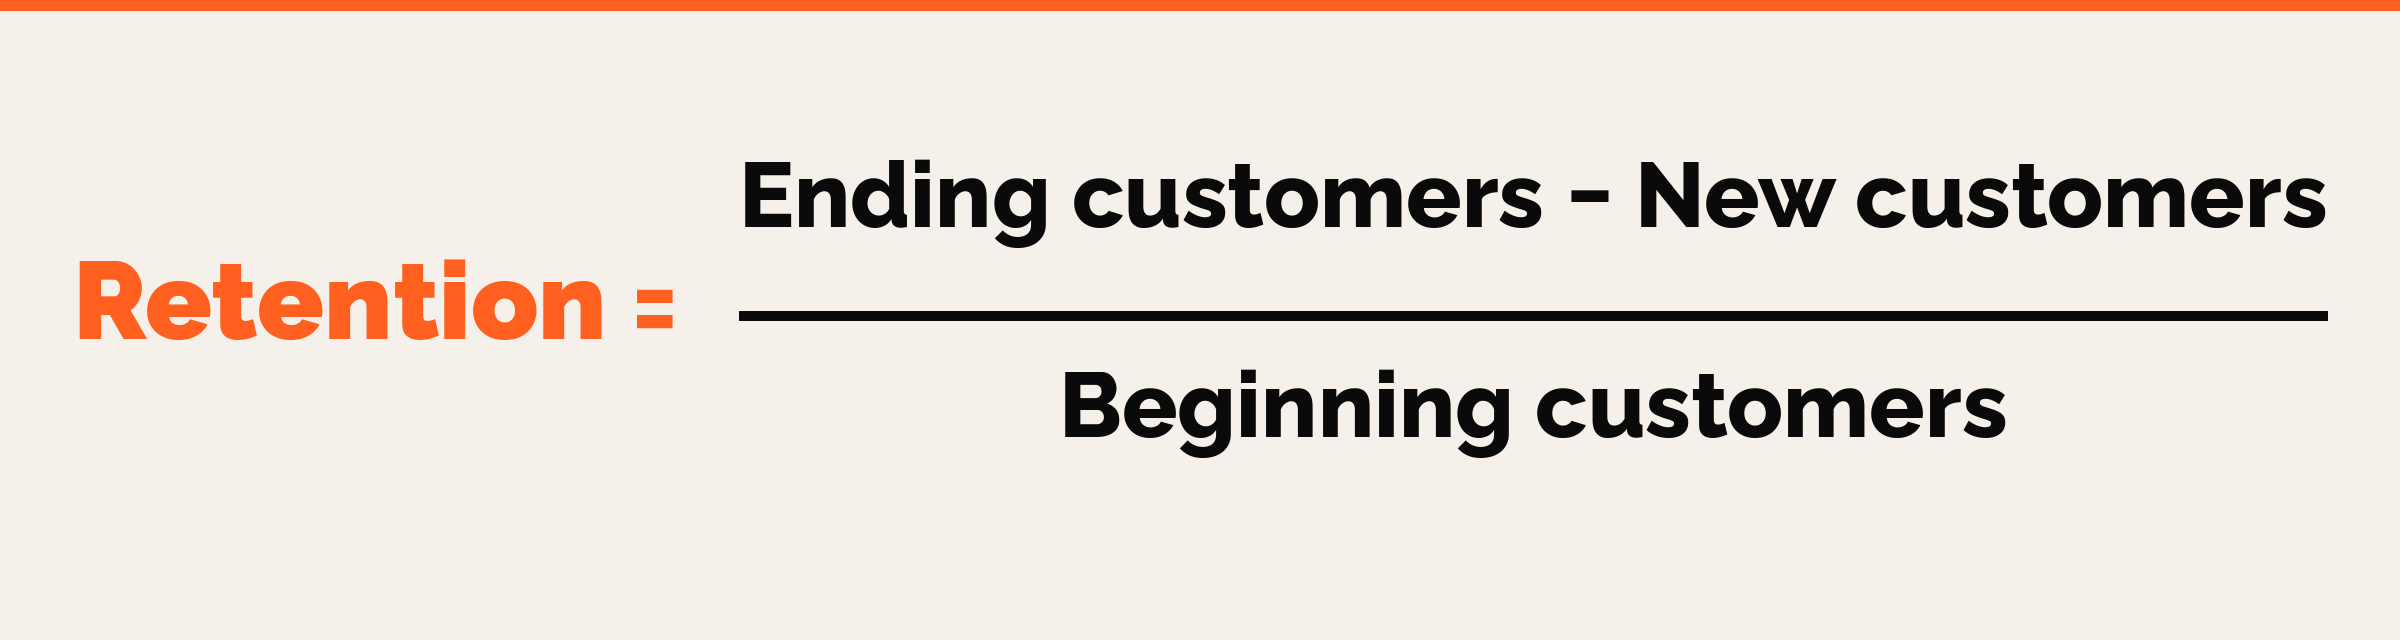
The formula puts every plan in one number.
By month three, a monthly subscriber has paid three times. A quarterly one has paid once and hasn’t had a chance to leave.
Read instead: order-three retention, one row per plan.
4. Cohort average
The average row at the bottom of your cohort table includes last month’s subscribers.
They haven’t reached their second charge yet, so they can’t have cancelled at it.
Average them in and retention looks better than it is.
Read instead: only average cohorts old enough to reach that order.
5. Shopify returning customer rate
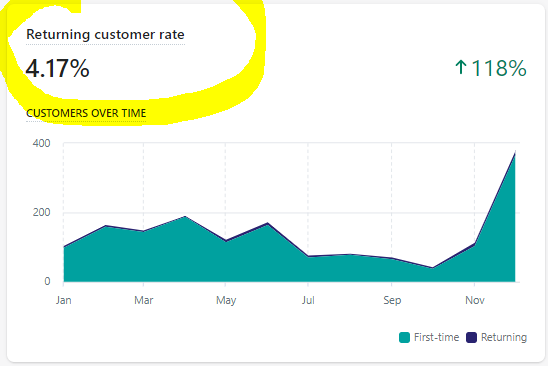
Shopify counts anyone with more than one order as returning.
Every subscription rebill counts as a return, so the number grows with your subscriber base. Nobody chose to come back.
It also climbs when new customers drop. A bad month for ads looks like a good month for loyalty.
Read instead: of last quarter’s first-time buyers, how many came back on their own.
6. Repurchase rate
Recharge shows a 12-month repurchase rate. On one brand, 57% of subscribers placed a second order, against 14% of one-time buyers.
But a subscriber’s second order is a charge they didn’t stop.
Read instead: how many subscribers reach order three.
7. Predicted LTV
One brand’s LTV came out three ways from the same data: $103.88, $44.41 and $100.12.
Predicted LTV is worse. It counts orders that haven’t happened yet.
Read instead: 12-month LTV, from what a cohort actually paid.
The two numbers I trust
Two numbers I trust are order-three retention and 12-month LTV, the real one.
Why not month two? That’s where people cancel because they didn’t realise it was a subscription. Fix it first, then judge the program at order three.
Both are hard to game. By the time you read them, the money is already in the bank.
If you’re a small brand, read cash payback first. LTV pays eventually. Payback pays this month.
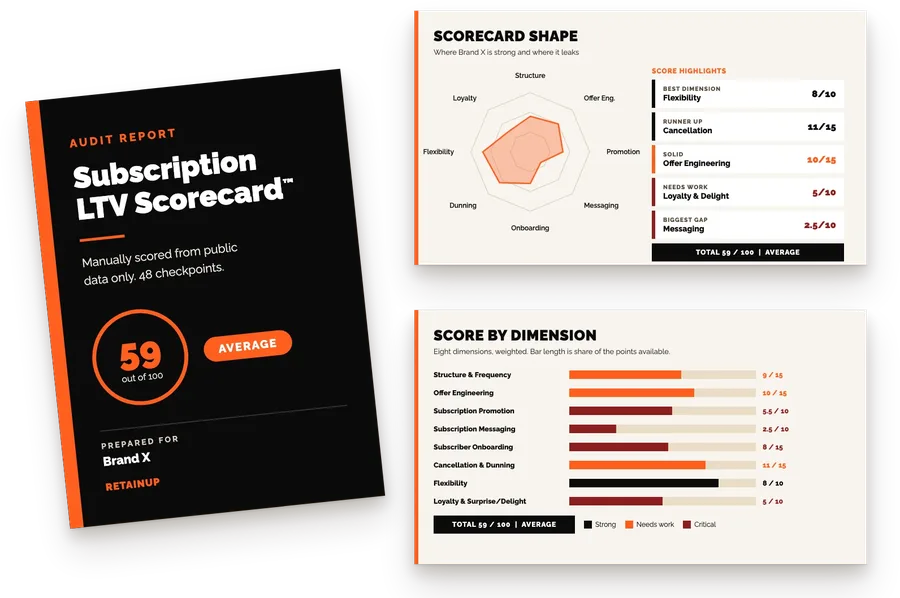
Want to know which of the seven your dashboard is showing you? Get your free Subscription LTV Scorecard.
One email a week on subscription retention: the numbers, the strategy, and what to fix first.

Rahi Jain
Rahi Jain is a subscription LTV specialist who helps DTC brands maximize their LTV from subscriptions.
More about Rahi