
Key takeaways
- Unit economics puts your P&L on a base of 100, so every cost reads as a percentage of net revenue.
- Under 5% net profit is a dead zone: a typical DTC brand with 20% fixed costs lands between 3% and 14%.
- Lifting AOV from $100 to $200 cut one marketing line from 30% to 15% of revenue while COGS fell 10 points.
The best way to read any ecommerce business is through its unit economics. It is your P&L cut down to one unit sold, so you can see where each dollar goes.
I have worked with 50+ brands on profitability, as an agency owner and an ecommerce co-founder. This is the framework I use, with the scenarios we run on top of it.
What unit economics tells you
Take one unit sold. What did the goods cost, what did fulfillment cost, what did you spend to win the order, and what fixed cost sits on top?
If those numbers hold, they hold at 100K units and at a million. That is rarely true, so we model each scale: 100K, 1 million, 10 million, 100 million. Unit economics shows today’s cost structure, where to improve it, and what the business looks like at scale.
How to calculate it
Grab your P&L and collapse it into four or five headers. Then divide everything by net revenue, so revenue reads as 100.

- Net revenue: gross revenue minus discounts, returns and shipping income.
- COGS: product cost, freight, duties, import duty, storage and container fees. Everything to get the product to your warehouse.
- Fulfillment: packaging, labor, 3PL, last mile carrier. Payment gateway fees can sit here or on their own line.
- Marketing: ad spend, agency, tools, influencers, and branding spread over 12 months.
- Contribution margin: what is left before fixed costs.
- Fixed costs: rent, salaries, software such as ClickUp or Notion. What remains is net income.
Keep the headers simple and do the sums on a base of 100. Watch your rounding. I run this by quarter and compare it with the year before.
Contribution margin is the money each order sends toward fixed costs. I cover it in ecommerce contribution margin.
What a DTC brand looks like
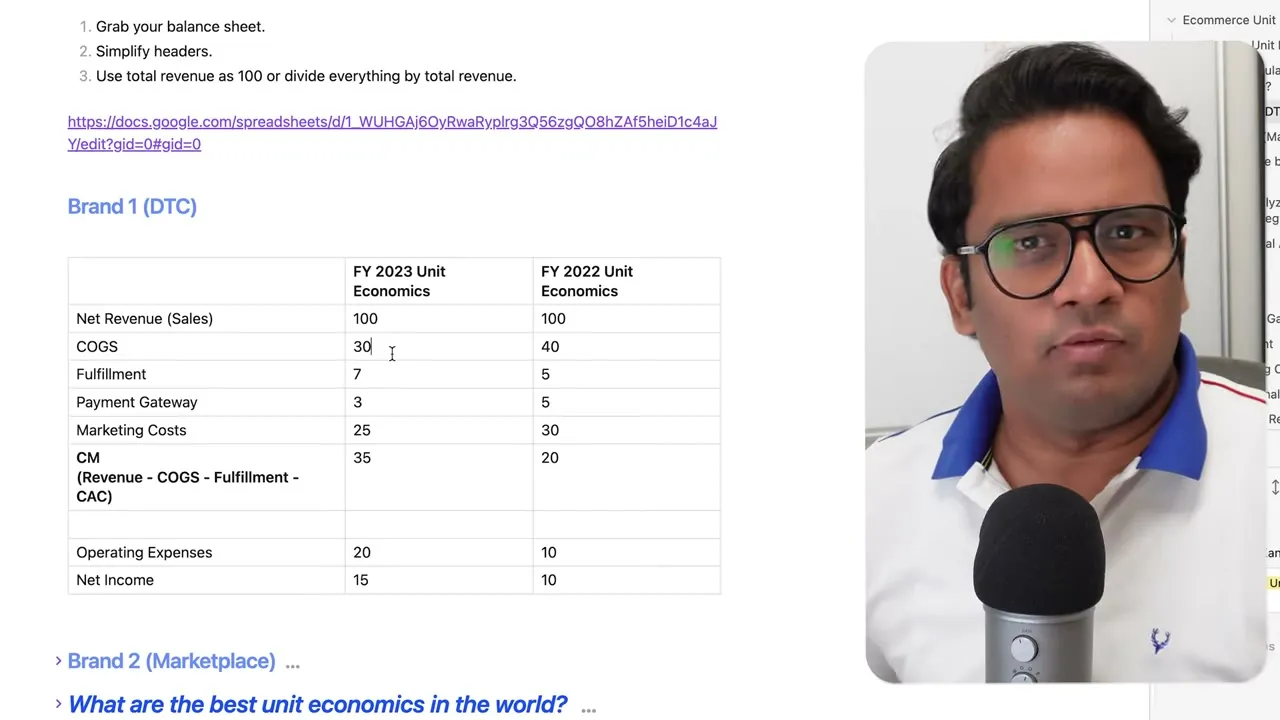
On a base of 100, a typical DTC brand with its own manufacturing spends about 34 on COGS. Fulfillment and 3PL run 5 to 10, payment gateway 2 to 3, and acquisition 25 to 30. Fulfillment sits closer to 5 on a $100 product and climbs on a $30 product.
Here are those ranges with my own arithmetic added, using fixed costs of 20.
| Line (per 100 of net revenue) | Lean | Heavy |
|---|---|---|
| COGS | 34 | 34 |
| Fulfillment | 5 | 10 |
| Payment gateway | 2 | 3 |
| Marketing | 25 | 30 |
| Contribution margin | 34 | 23 |
| Fixed costs | 20 | 20 |
| Net profit | 14 | 3 |
Same brand, same COGS. Profit swings from 14 to 3 on fulfillment and marketing alone. Scaling on thin margins is a trap, which I cover in D2C scale unit economics.
Marketplaces run the other way
A marketplace selling phones, electronics or branded apparel earns 30 to 40% margins, so COGS is 60 to 70 of every 100. Fulfillment is tiny because tickets are large. Payment gateway has a floor of 1.8 to 2% because of Visa and Mastercard. Marketing has to stay small.
What the best brands look like

A study of 700 ecommerce businesses gives a best-in-class P&L by industry. Gross margin averages 69%. Beauty and health sit at the top. Electronics, sporting goods, snack bars and drinks sit at the bottom.
The margin tells you the marketing budget. A beverage brand with a thin gross margin has to hold marketing near 10% of revenue, and repeat purchase makes that possible. Cosmetics and health can spend about 30% to generate demand.
Fixed costs run near 20% for most ecommerce brands. Pet and food are lower, electronics higher. So you have three levers: margin, marketing and fixed cost.
Where to pull each lever
Go header by header.
- TAM: is there room to grow? Go international or add a category.
- Revenue: raise price or AOV. A $100 product at 70% COGS becomes a $200 bundle at 60%. Marketing stays at $30, so it drops from 30% to 15% of revenue.
- COGS: change supplier, change the formula, negotiate on volume. Taking a $6 unit to $5 on a $50 product is worth about 2% of revenue. Cut too far and quality, reviews and retention suffer.
- Payment gateway: little room. 1.8% is the lowest I have seen, and customers still ask for PayPal or Amazon Pay.
- Fulfillment: I have seen big wins here, usually from consolidating 3PLs or switching between offshore and on-site providers.
- Marketing: three buckets: cheaper paid, organic (SEO, organic social, affiliate), and more from existing customers through email and loyalty.
- Fixed costs: move fixed to variable, such as a lean summer team that scales for Black Friday.
Hiring shows the tradeoff. A brand under 7 figures of net revenue at a 20% profit makes about $200K. A VP at $150K takes most of it, unless that hire lifts revenue to $2 million or $5 million.
The common moves repeat across brands: raise retention, raise AOV, lift gross margin with price or lower COGS, add free traffic, and cut marketing as a share of revenue. For retention, see our profitable growth framework.
Run scenarios before you commit
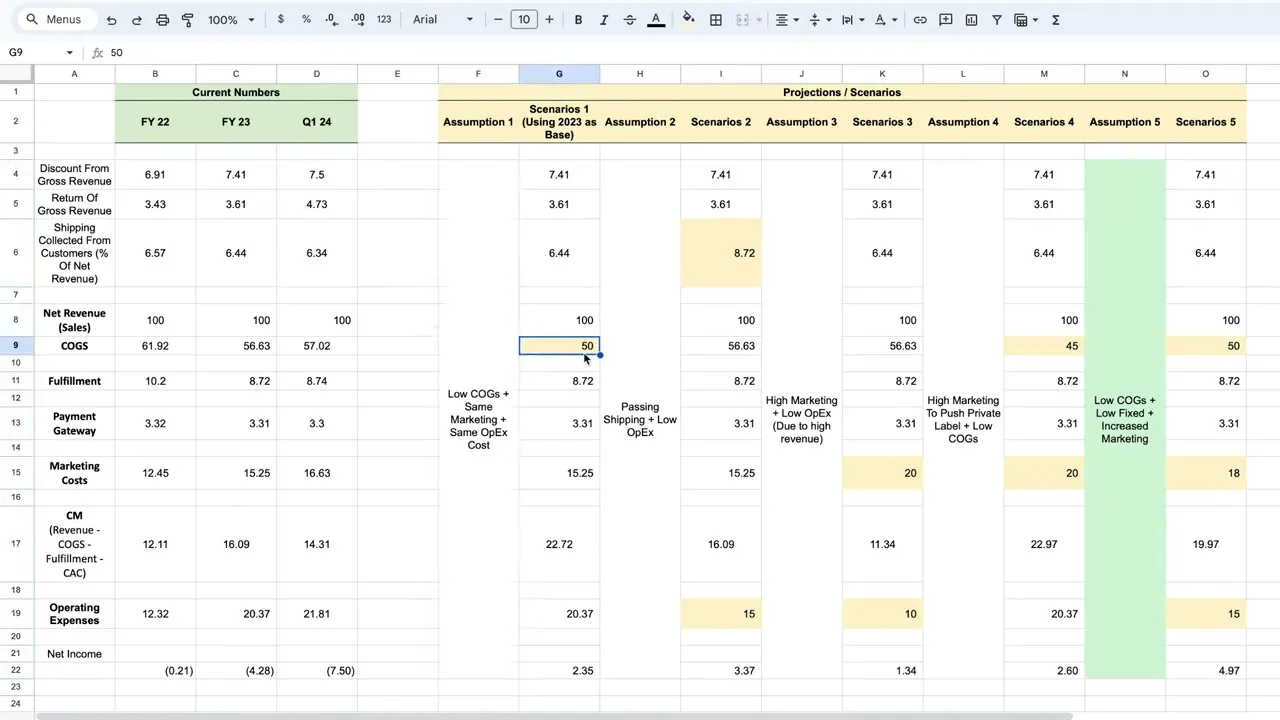
Once you have a plan, run it through the numbers. We build a projection sheet and change one thing at a time.
- Lower COGS: negotiate suppliers and take COGS from 56 to 50. Everything else stays put.
- Free shipping: change the shipping threshold and watch fixed cost drop as a share of revenue.
- More marketing: keep the team the same, spend more on ads to grow revenue, and let fixed cost shrink as a percentage. Do you still make a profit?
- Private label: push your own products for margin.
In the high marketing scenario we still made a profit, but a small one. Anything under 5% is a dead zone, in my view.
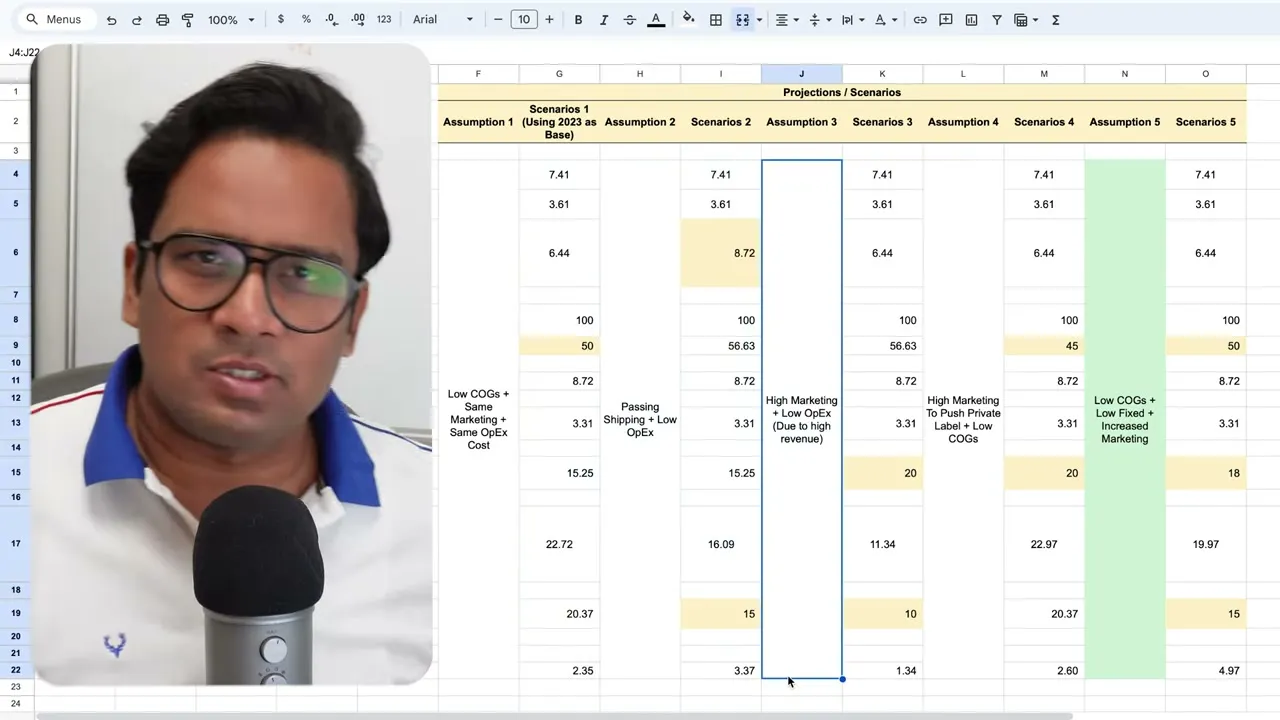
We pick the strategy that pulls two or three levers and make that the North Star. Nothing has changed in the business yet, and there is no guarantee. But now the whole brand has one plan across several levers.
Want to see where your own numbers stand? Get a free subscription audit with the Subscription LTV Scorecard.