Key takeaways
- In one worked example at $27 gross profit per order, the simple churn formula gives $338 of subscription LTV while the cohort paid $137 in 12 months.
- Recharge data on about 1,800 supplement brands shows 86.6% of subscribers reach order 2 and 57.6% reach order 3.
- In the same example, lifting order 3 retention from 59% to 70% raises 12-month subscription LTV from $137 to $174.
Ask a founder for their subscription LTV and you get a number in about two seconds.
Ask how they got it and it is nearly always the same sum. Monthly revenue, times margin, divided by the churn rate on the app dashboard. Sometimes it is the predicted LTV from Klaviyo or Lifetimely, which is worse.
I open 10 to 20 cohort charts a month across different brands. The number the founder quotes is almost always higher than the cash the cohort actually paid. Often twice as high.
This guide covers what subscription LTV is for a DTC brand, how to calculate it by cohort with a full worked example, why the simple formula misleads, benchmarks by order number, and the five levers that move it.
What is subscription LTV for a DTC brand?
Subscription LTV is the gross profit a subscriber pays you over a set window, counted from their first paid subscription order. We use 12 months. It is a budget number: it tells you what you can pay to acquire a subscriber and still make money.
Three things in that line matter.
- Gross profit, not revenue. After the first-order discount, product cost, shipping, packaging and payment fees. A $45 order at 60% margin is $27, and $27 is the number you work with.
- A window. 12 months for cash decisions. Lifetime LTV is a ceiling, never a planning input. Eightx gives the same split: 12 months for cash, 24 for strategy (Eightx).
- Subscribers, not customers. Keep one-time buyers out of it. Blend them in and one big acquisition month moves the number more than anything you changed.
For a DTC brand there is a second number on top: customer LTV, which mixes subscribers and one-time buyers by your take rate. More on that in the levers. And if you plan to sell one day, this is also the number an acquirer looks at first. Subscription LTV sets your exit multiple more than revenue does.
The simple subscription LTV formula
The formula most guides give is LTV = monthly gross profit ÷ monthly churn. Lifespan is 1 ÷ churn, so at 8% churn a subscriber "lasts" 12.5 months, and $27 × 12.5 = $338.
It is a fine sketch. I use it myself to show founders how much a few points of churn are worth, and the full walk-through is in LTV math: how churn sets your maximum CAC. Cut churn from 15% to 5% and LTV triples on paper.
The trouble starts when that sketch becomes the number you set CAC with. For that you need the cohort.
How to calculate subscription LTV by cohort
Take everyone who placed their first paid subscription order in the same month, count what share of them paid each order after that, and multiply each share by your gross profit per order. Add it up to order 12. That is 12-month LTV per starting subscriber, made only of money that already arrived.
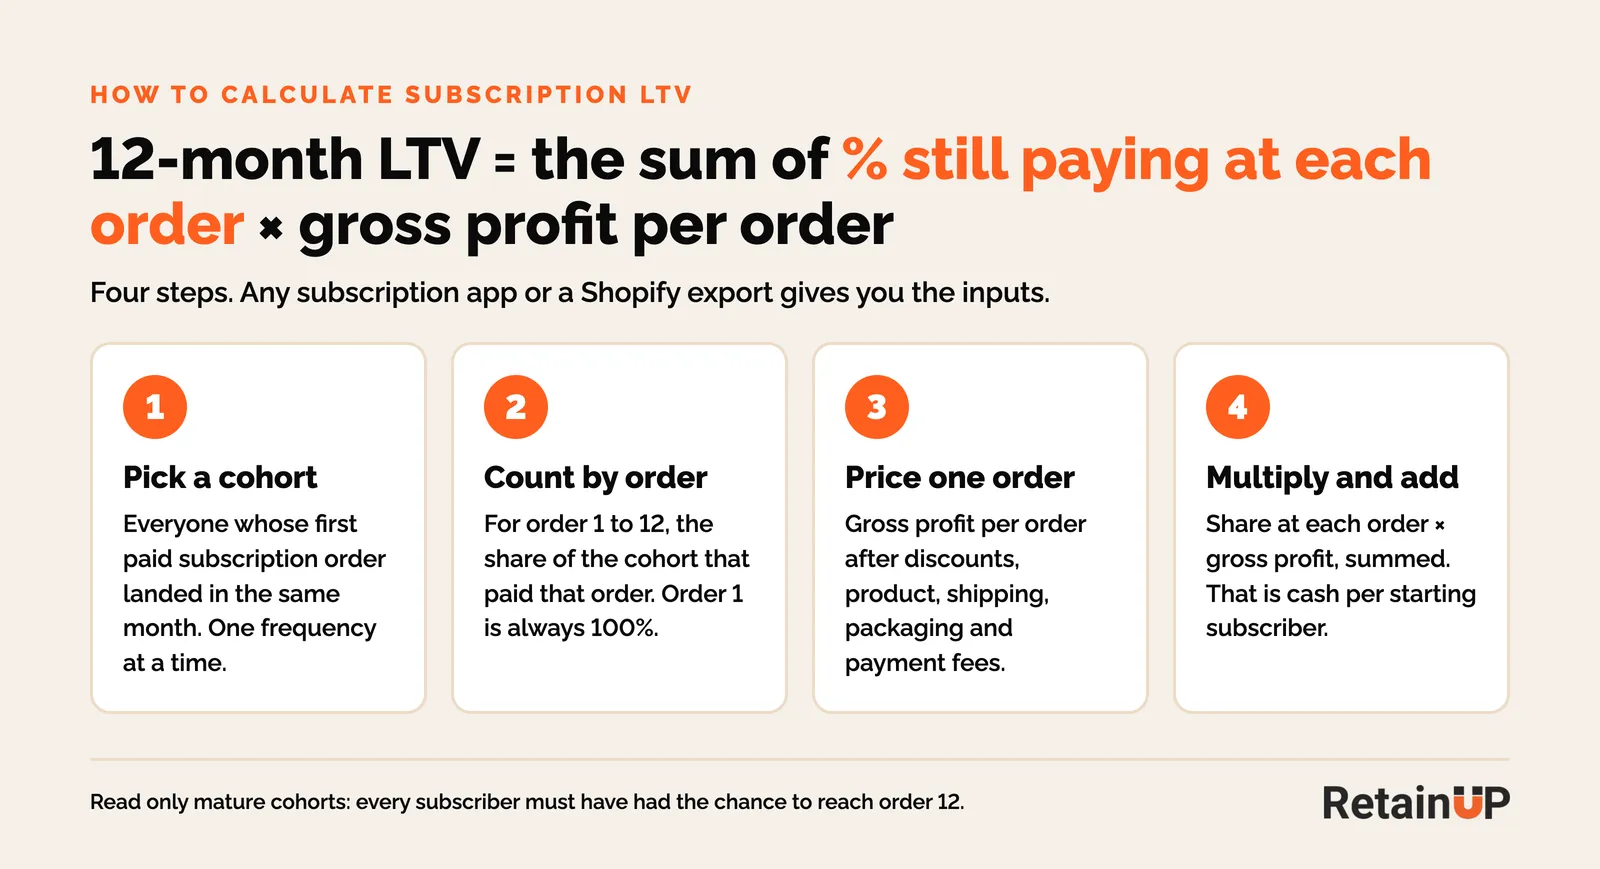
12-month LTV = Σ (share of the cohort that paid order n × gross profit per order), for n = 1 to 12
- Pick a cohort. Everyone whose first paid subscription order landed in March, say. One frequency at a time: a quarterly subscriber at month three has paid once, a monthly one three times.
- Count by order, not by month. Order 1 is always 100%. Then the share that paid order 2, order 3, and so on.
- Price one order. Gross profit after discounts, product, shipping, packaging and payment fees. If later orders carry a different price, use each order's own figure.
- Multiply and add. Share at each order × gross profit, summed to order 12.
Worked example: 400 March subscribers
A supplement at $45 a month, 60% margin, so $27 of gross profit per order. 400 people placed their first paid subscription order in March. Here is what they did.
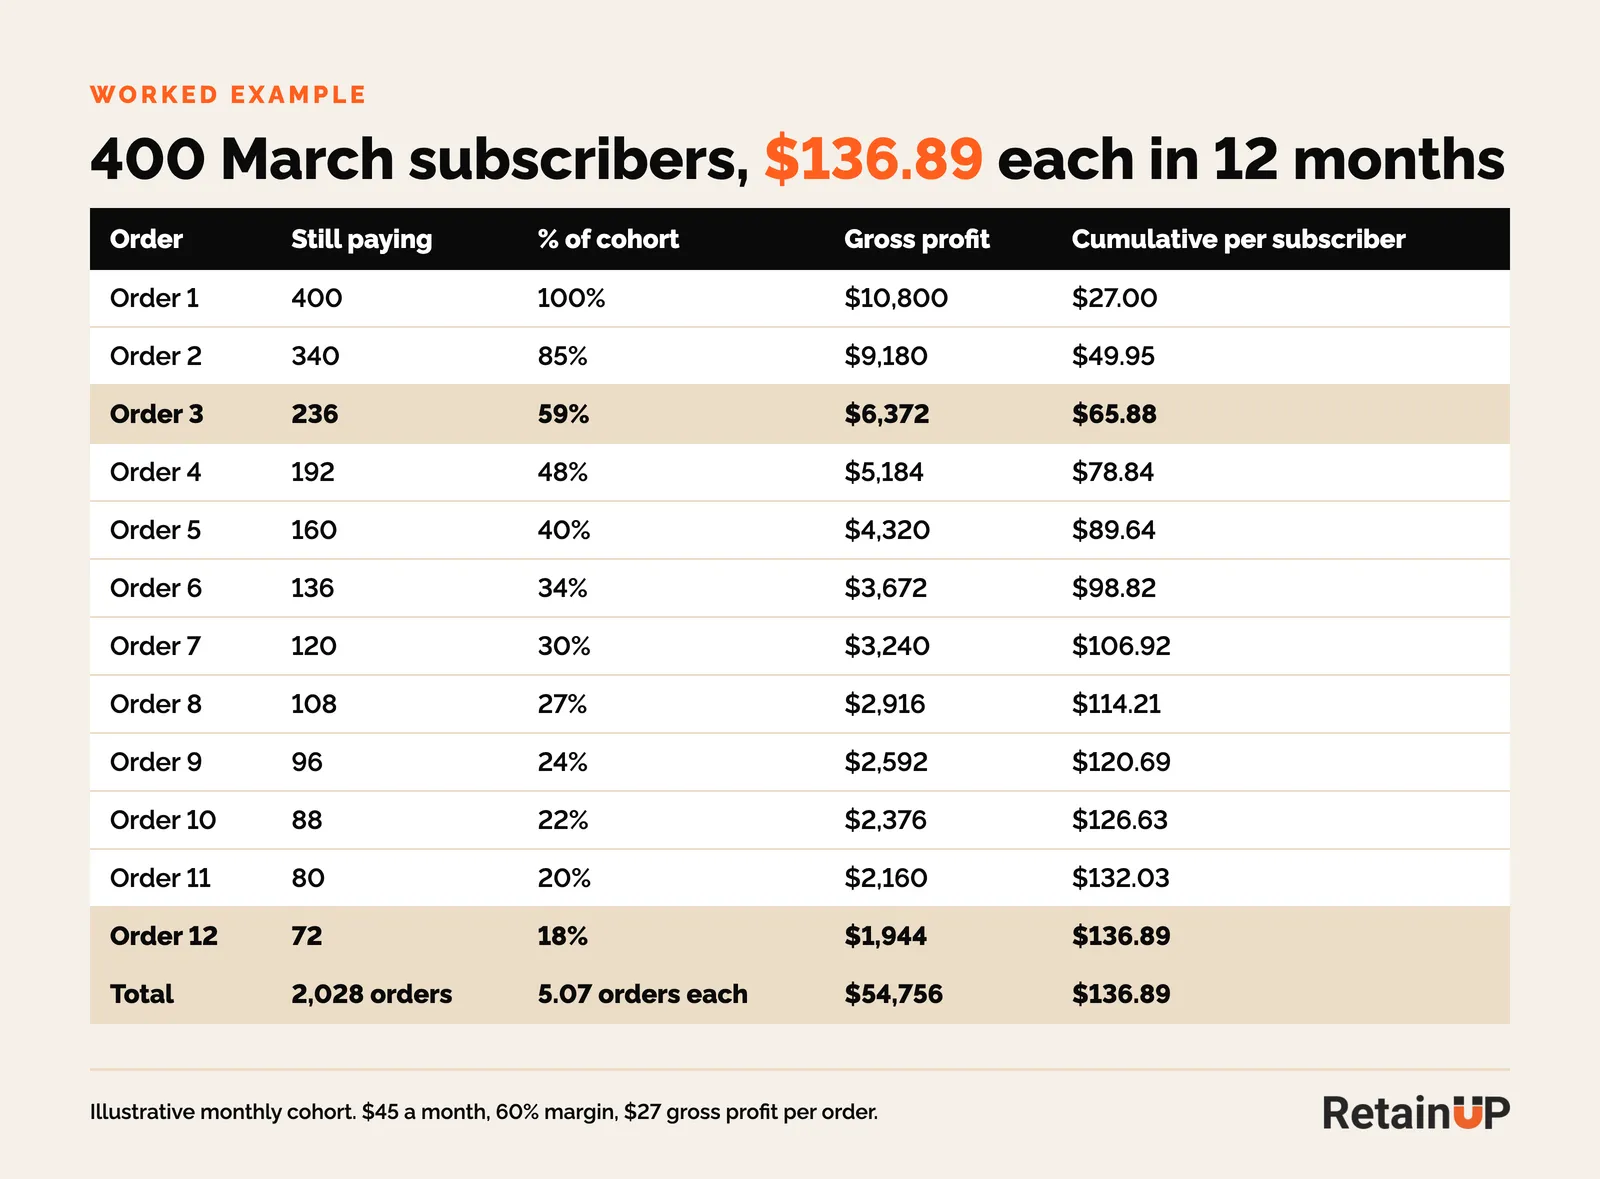
236 of 400 paid order 3, so order 3 retention is 59%. By order 12, 72 are left. Across the 12 orders the cohort placed 2,028 orders, 5.07 per starting subscriber, worth $54,756 of gross profit.
$54,756 ÷ 400 = $136.89. That is the 12-month LTV. Nobody can argue with it, because it already happened.
Two rules before you trust your own version. Only use mature cohorts, where every subscriber has had the time to reach order 12 plus about 30 days for skips and payment retries. And leave failed payments still in retry out of the count until they resolve.
Where to get the numbers in your app
| App | Where | Watch for |
|---|---|---|
| Skio | Analytics, Cohort Dashboard, Retention by order count | Switch the toggle to Subscribers, not Subscriptions |
| Loop | Analytics, Cohorts, Order-Level view | Filter by delivery frequency and read each plan on its own |
| Recharge | Analytics, Subscription Journey, Subscription Retention by Order Number | Check it shows survival from order 1, not step rates from one order to the next |
| No report | Export subscription orders from Shopify | Drop $0 orders, number each customer's orders by date, group by month of order 1 |
If you have never read a cohort chart, start with the three reads of a subscription cohort chart. Across, down and diagonal each tell you something different.
Why the simple formula misleads
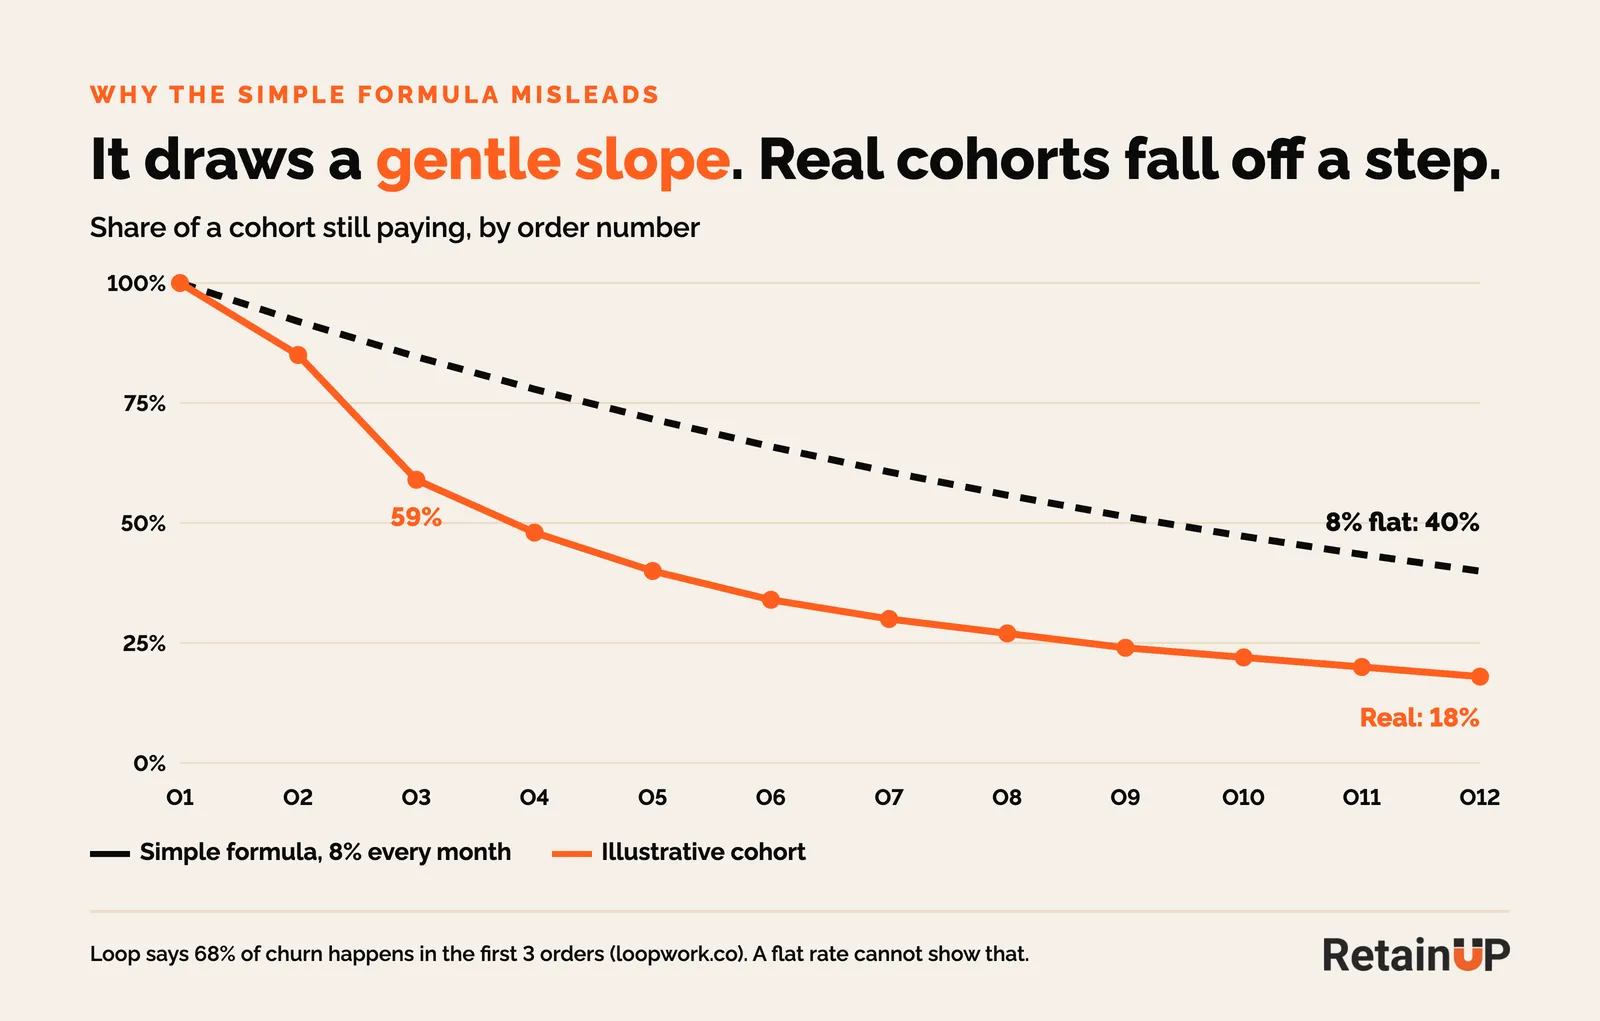
Same 400 subscribers, same $27 per order. The simple formula, using the 8% churn rate the app dashboard shows, says $338. The cohort paid $137 in 12 months.
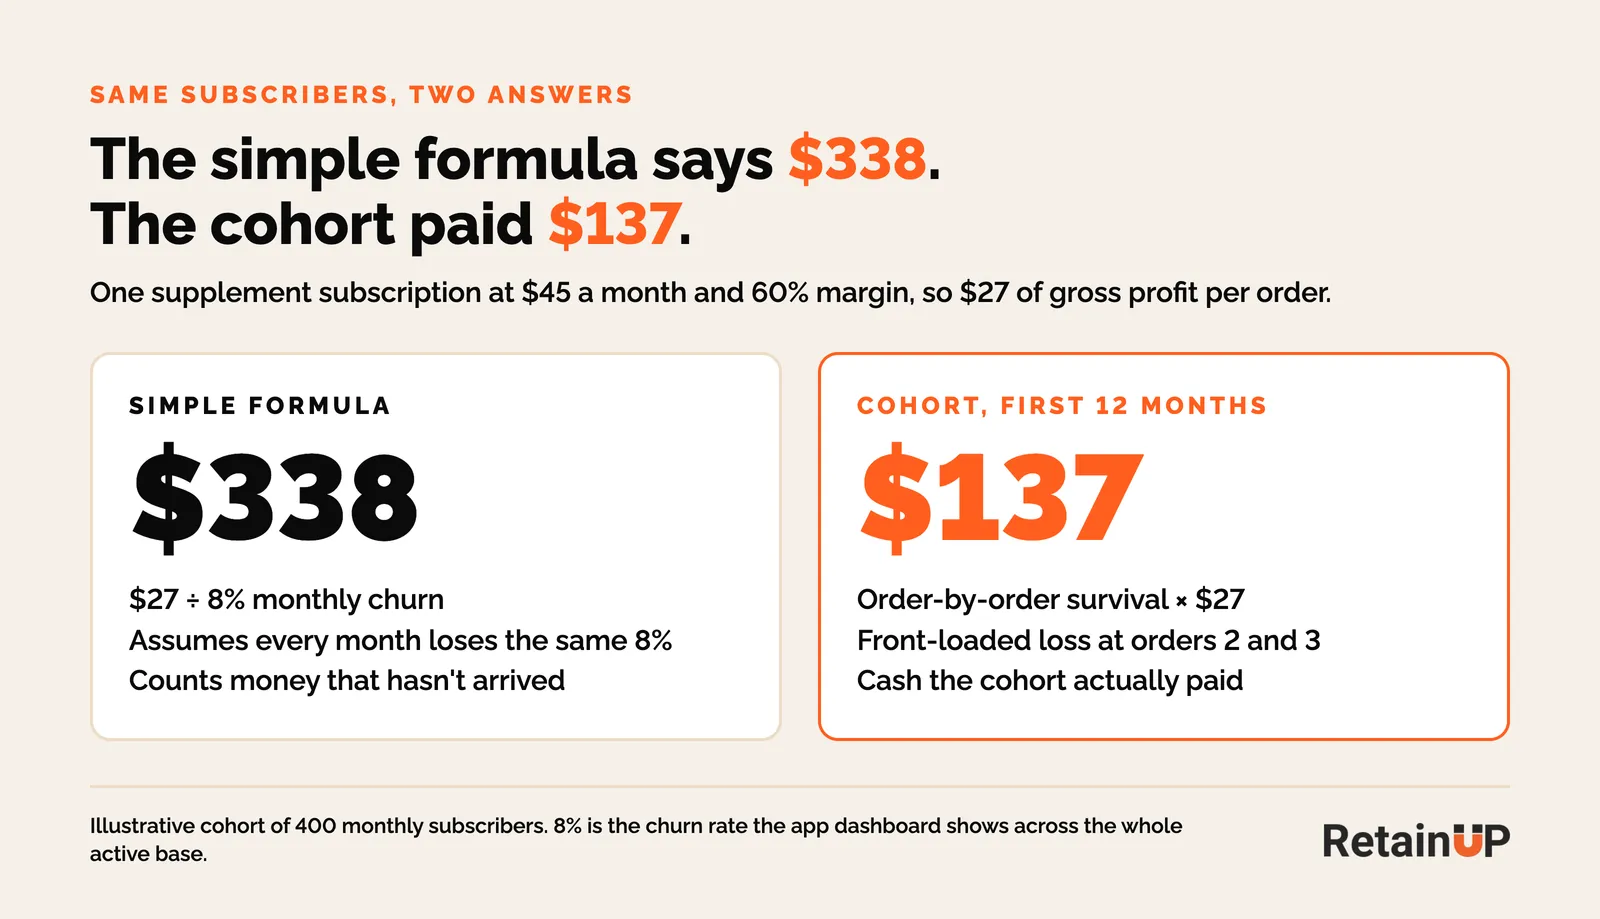
Five reasons the gap is that big.
1. It assumes every month loses the same share
Real cohorts lose most people at orders 2 and 3, then flatten. Loop says 68% of all churn happens in the first 3 orders (Loop). A flat 8% draws a gentle slope where the real curve falls off a step.
2. The dashboard churn rate is mostly survivors
Your app divides cancellations by every active subscriber. Most of the active base are people who already made it past order 3 and churn slowly. So the rate looks calm while each new cohort loses 41% before its third order.
3. It mixes billing frequencies
A monthly subscriber faces 12 renewal decisions a year. A quarterly one faces 4. Put them in one churn rate and the number partly measures your plan mix.
4. It counts money that has not arrived
Cap the simple formula at 12 months and it still says $213, because it carries 40% of the cohort to order 12 instead of 18%. Run the real curve forever, with the survivors leaving at 8% an order, and you get about $193. And you wait years for it.
5. Predicted LTV inherits all of this
Predicted LTV from Klaviyo, Lifetimely or Yotpo counts future orders on top. Eightx puts the overstatement at 20 to 40% against actual cohort LTV (Eightx). I once saw one brand's LTV come out three ways from the same data: $103.88, $44.41 and $100.12. Run actual and predicted side by side until they agree within 10%.
12-month LTV vs payback
LTV tells you how much a subscriber is worth. Payback tells you when the money comes back. For a brand paying for growth out of its own cash, payback decides how fast you can grow.
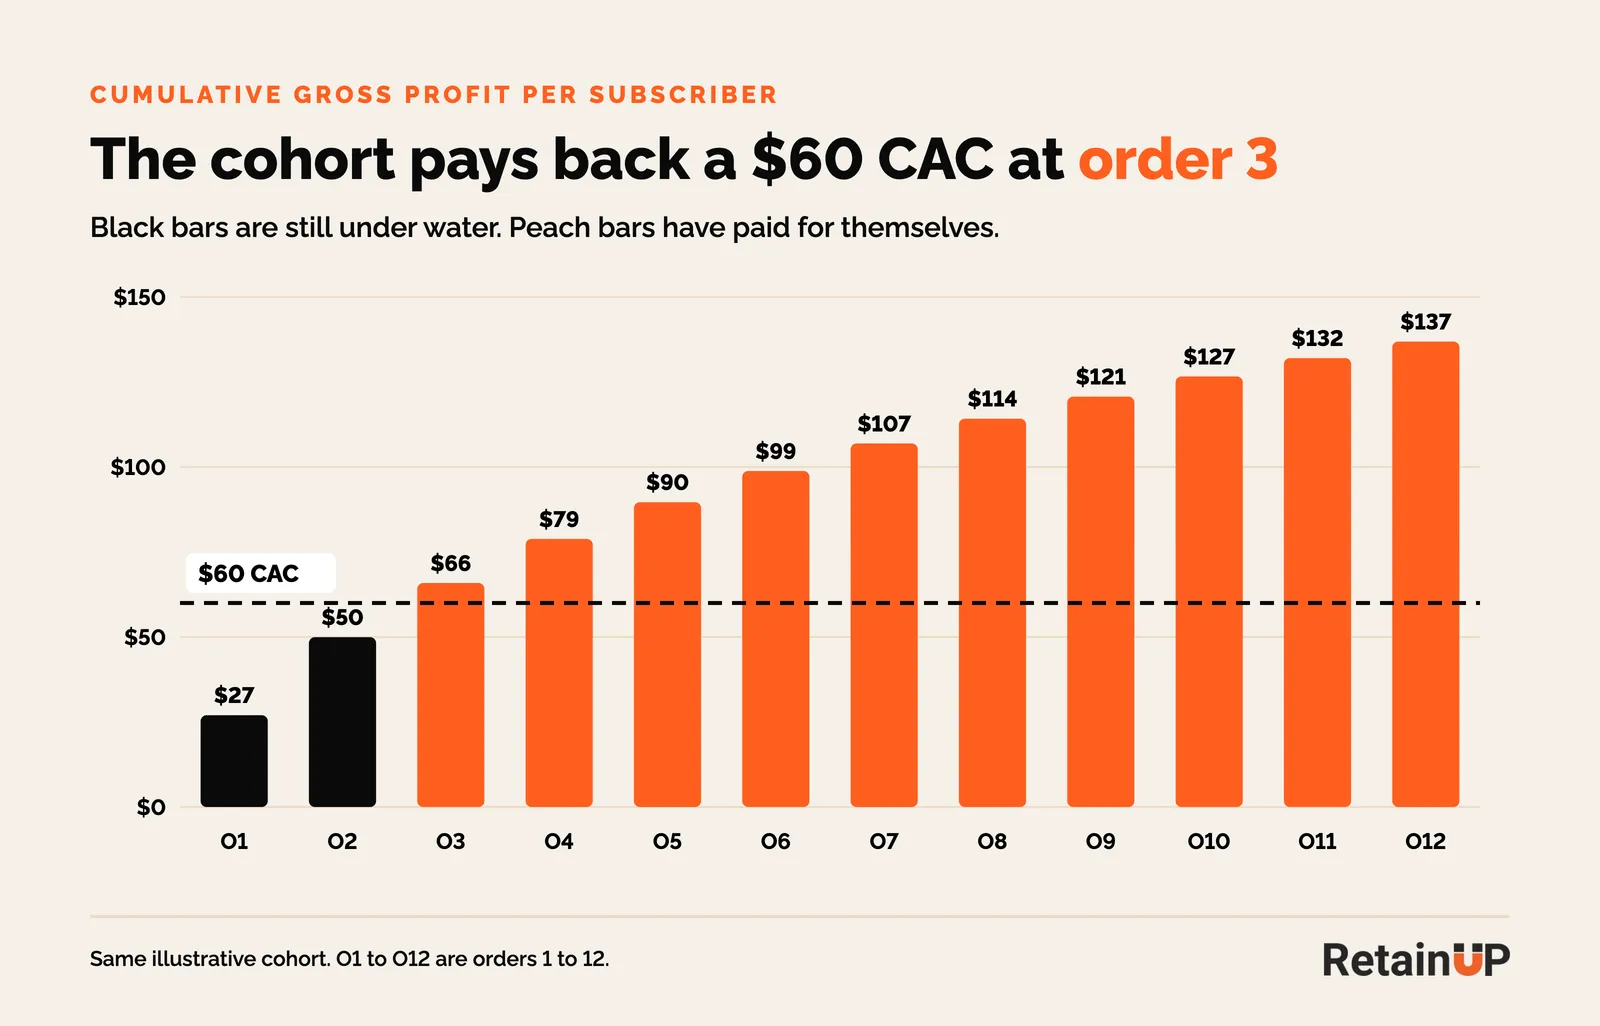
At a $60 CAC, the March cohort is under water after order 1 ($27) and order 2 ($49.95). Order 3 takes it to $65.88. Payback lands at order 3, around day 60. Every subscriber lost before order 3 cost you money. More on this in payback, not lifetime.
To turn 12-month LTV into a CAC ceiling, divide by your target ratio. At 3:1, $137 gives a $46 ceiling. At 2.5:1, about $55. Eightx argues DTC brands should aim for 2.5:1 to 4:1 on 12-month contribution margin rather than the SaaS 3:1 rule (Eightx). The ratio itself is covered in the LTV to CAC ratio.
Subscription LTV benchmarks by order number
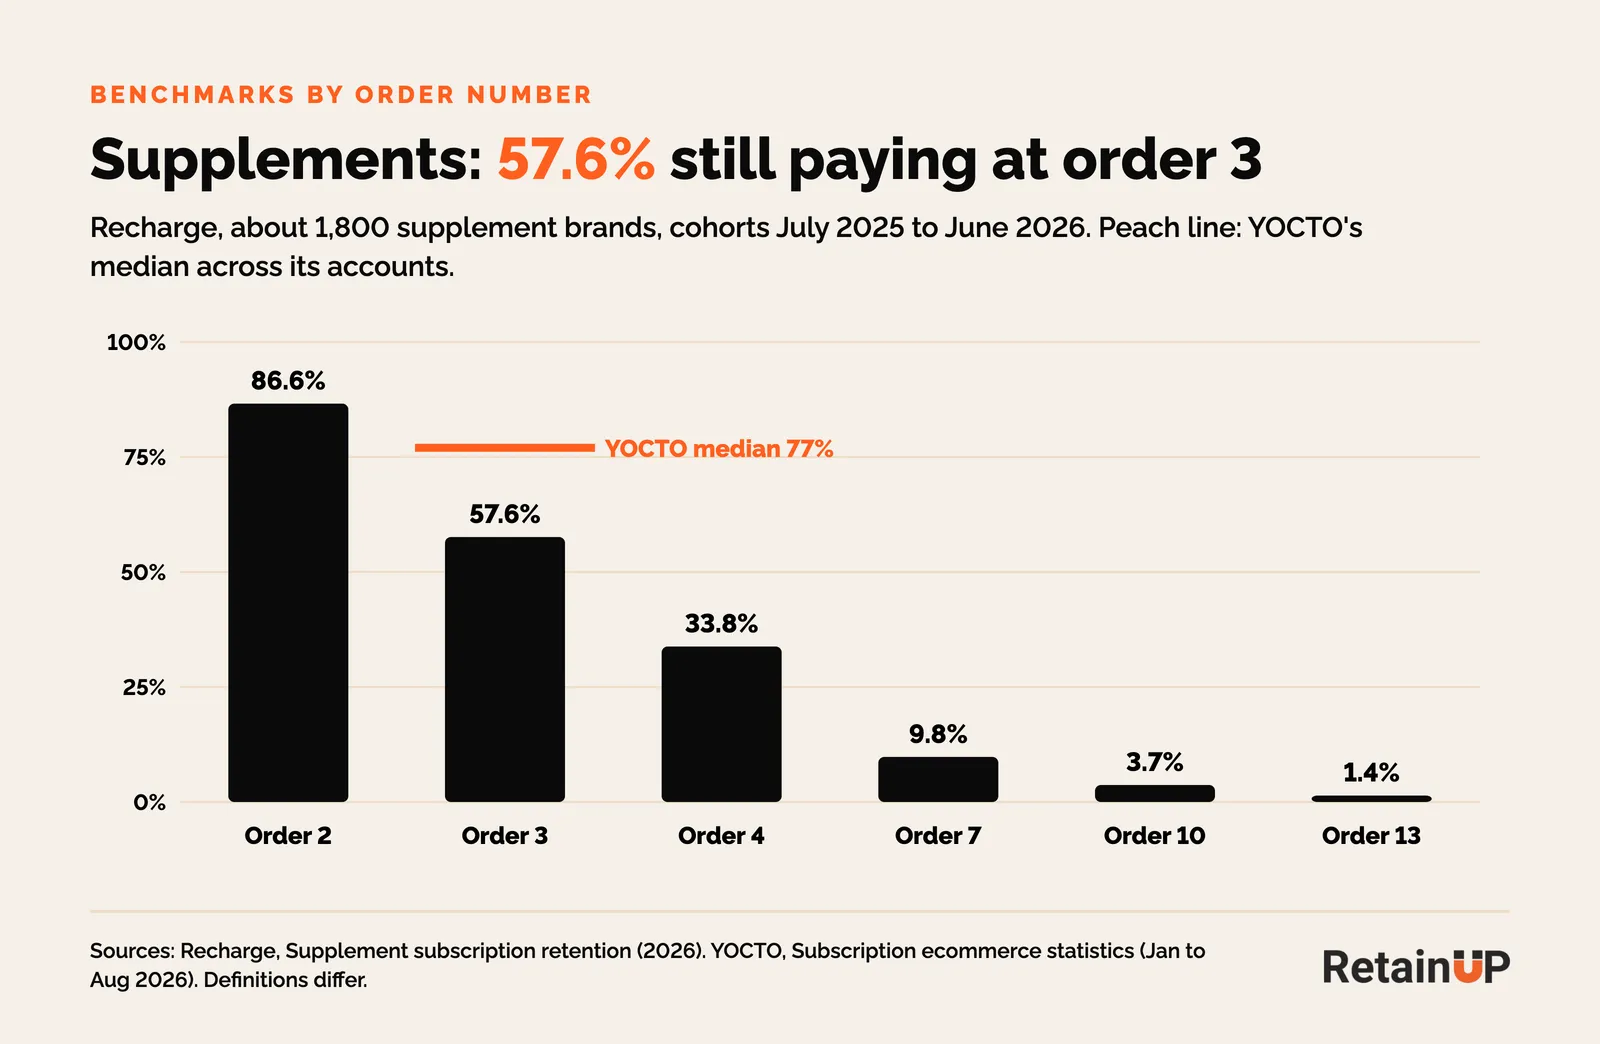
Benchmark the curve, not the dollar figure. Recharge's data on about 1,800 supplement brands shows 86.6% of subscribers reach order 2, 57.6% reach order 3 and 33.8% reach order 4. YOCTO's median across its accounts is 77% at order 3.
| Order | Recharge, supplements | YOCTO | RetainUP "good" band |
|---|---|---|---|
| Order 2 | 86.6% | 90 to 95% | |
| Order 3 | 57.6% | 77% median (49% weakest, 83% best) | 62 to 72% |
| Order 4 | 33.8% | ||
| Order 6 | 21.5% supplements, 46.3% food and beverage | ||
| Order 7 | 9.8% | ||
| Order 13 | 1.4% |
Sources: Recharge, supplement subscription retention, cohorts July 2025 to June 2026, counted by reorder (their "2nd reorder" is order 3). YOCTO, subscription ecommerce statistics, its own accounts, January to August 2026.
The two disagree by 20 points at order 3 on what looks like the same order. That gap is counting: subscriptions or subscribers, paused counted as active or as gone, $0 trials in or out. Always check the definition before you compare.
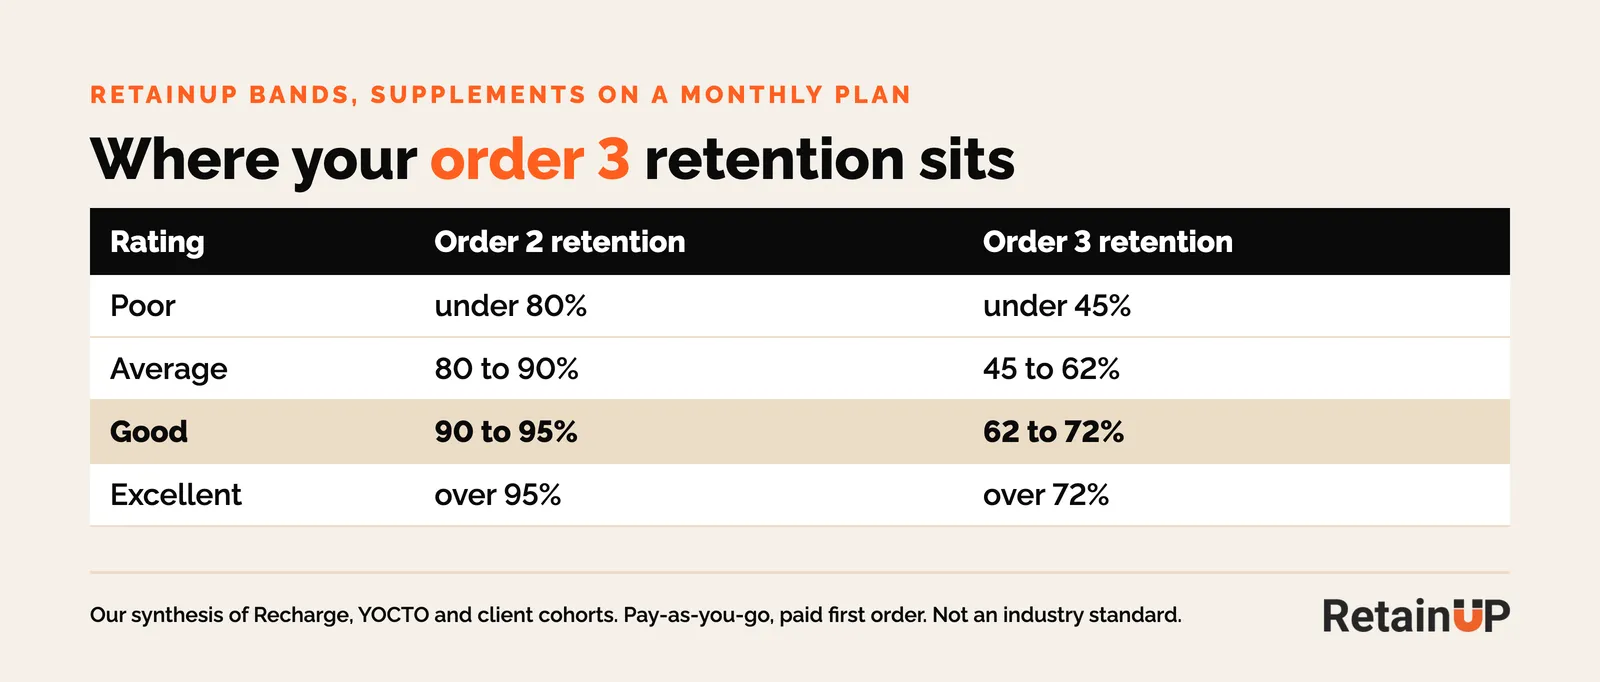
These are the bands we use for supplements on a monthly plan, pay-as-you-go, with a paid first order. Our synthesis, not an industry standard. The reasoning is in what is a good subscription retention rate.
What about dollar benchmarks?
Eightx puts subscription LTV for supplements at $500 to $1,000 and one-time LTV at $150 to $250, and subscription at 3 to 5x one-time across consumable categories (Eightx). Useful for direction. But a dollar figure depends on your price, margin and window, so a $45 product will never match a $90 one. Our example brand earns $137 in 12 months and is perfectly average.
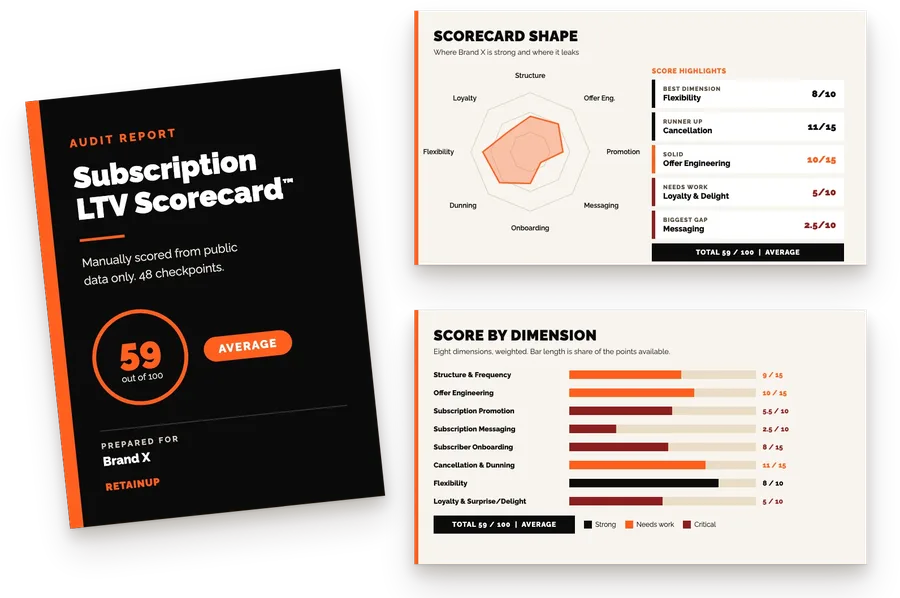
If you want to see how your program scores on the inputs to this curve, our free subscription audit runs 48 checkpoints across 8 dimensions.
The 5 levers that move subscription LTV
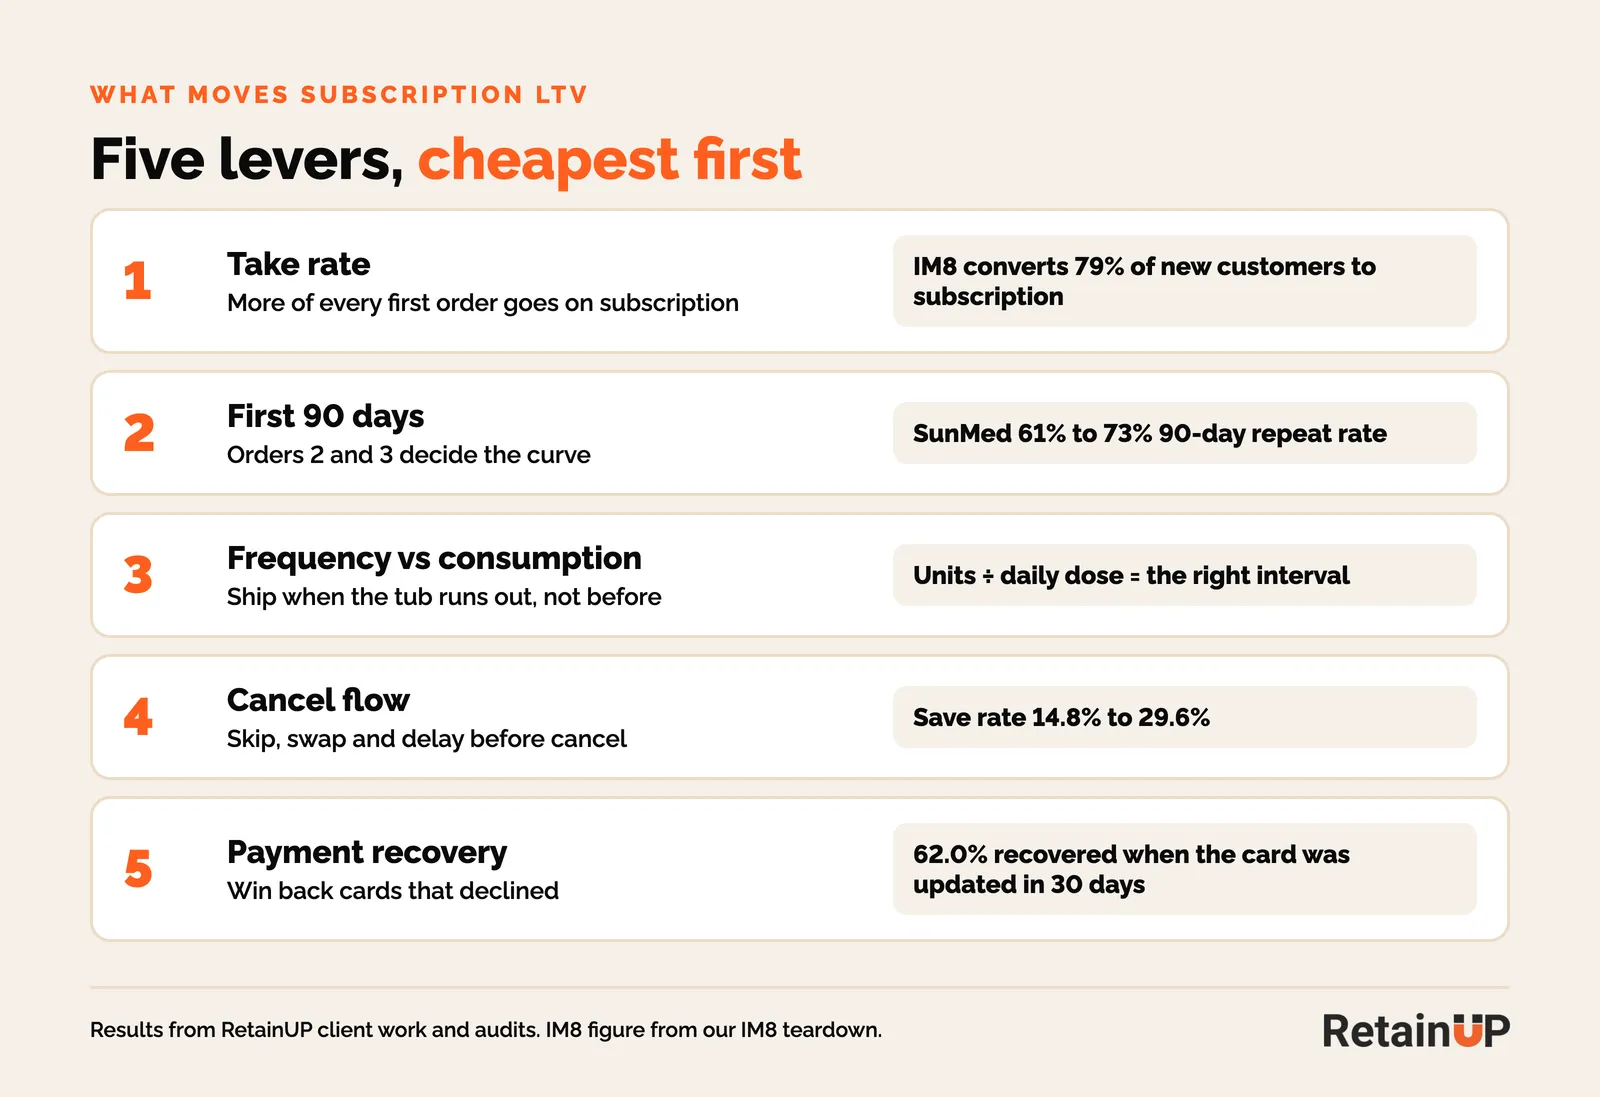
Five things move it: take rate, the first 90 days, frequency against consumption, the cancel flow and payment recovery. The first one changes how many customers become subscribers. The other four change how long they stay.
1. Take rate
Take rate is the share of first orders that go on subscription. It does nothing to subscriber LTV and a lot to customer LTV, because it applies to every buyer who walks in.
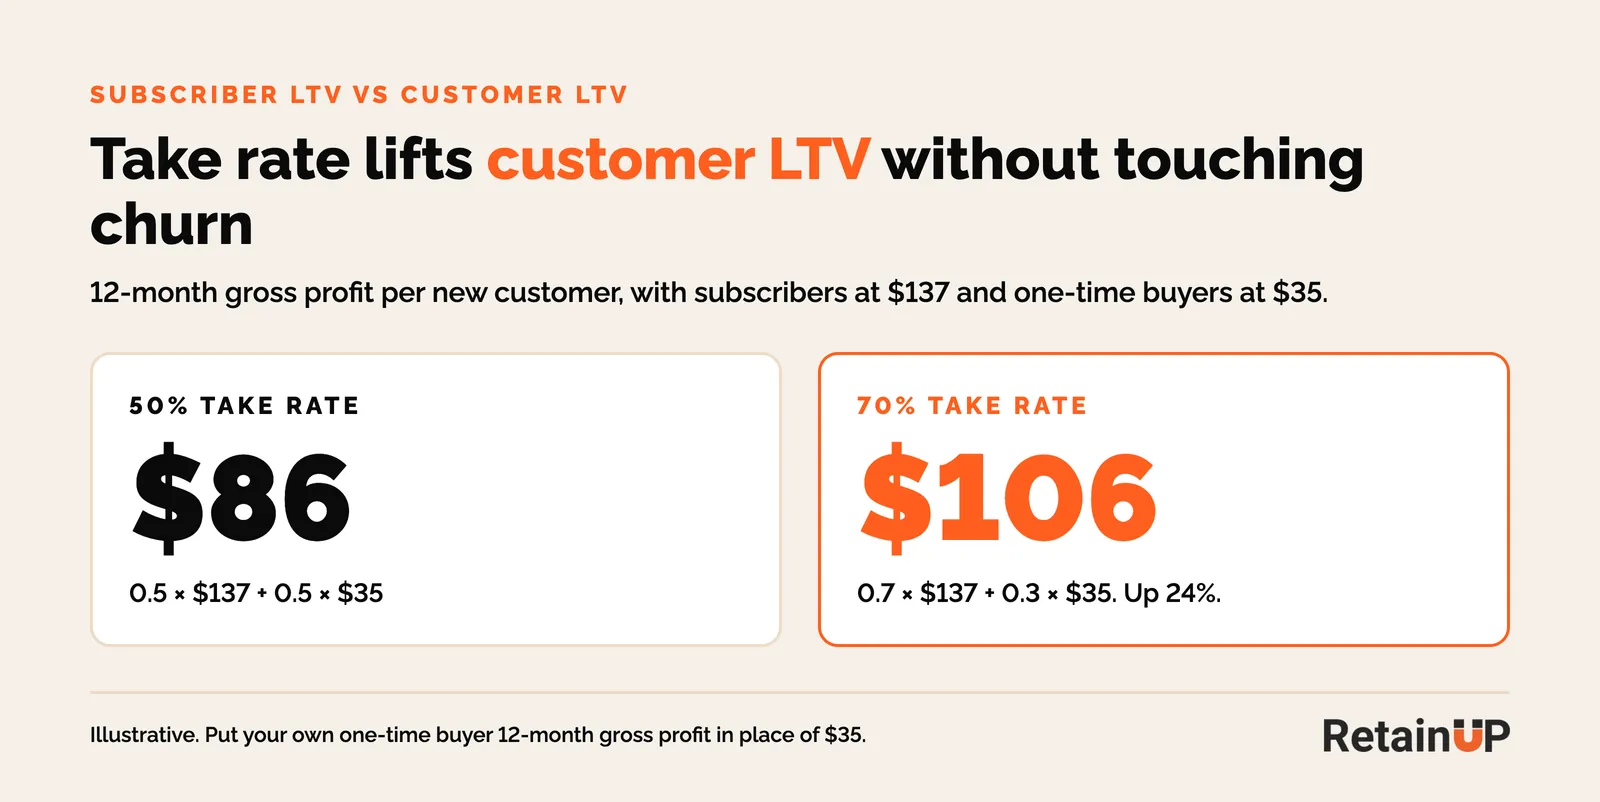
With subscribers at $137 and one-time buyers at $35, moving take rate from 50% to 70% lifts 12-month customer LTV from $86 to $106. Up 24% with no change in churn. IM8 converts 79% of new customers to subscription. Most health brands count 40 to 50% as a win.
One caution. Take rate bought with a deeper discount drags down every order's gross profit. Past 20% off you are buying a price anchor you can't keep.
2. The first 90 days
Orders 2 and 3 decide the curve. In the example, 41% of the cohort is gone before order 3, and they never paid back their CAC.
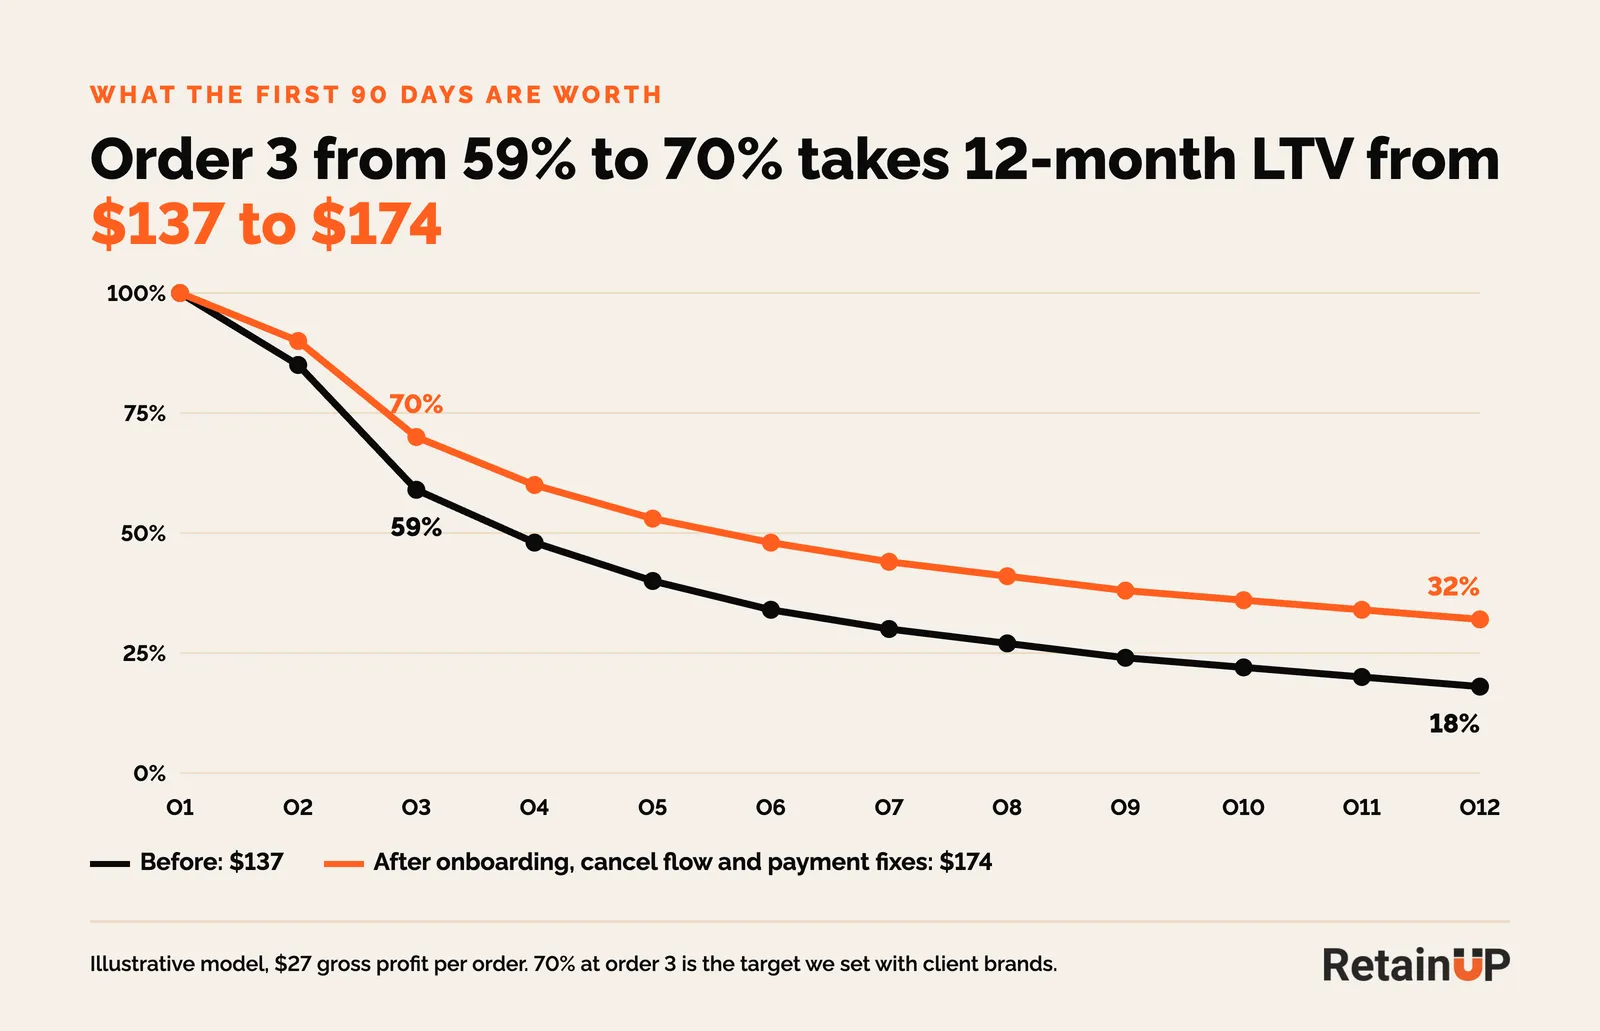
Lift order 3 retention from 59% to 70%, the target we set with client brands, and the rest of the curve rises with it. 12-month LTV goes from $137 to $174. What moves it: a re-commit message before order 2 ships with what to expect and by when, a reward announced for order 3, and gift value moved from order 1 to orders 2 and 3. SunMed went from 61% to 73% on 90-day repeat purchase rate. Boka went from 41% to 63%.
If order 2 is weak, look at onboarding and the offer. If order 2 is fine and order 3 drops, look at results, routine and the price step after the first discount.
3. Frequency vs consumption
Units per container divided by daily dose gives the days it takes to finish. That is your minimum billing interval. Ship faster than that and product piles up in the cupboard, and the subscriber cancels to clear the backlog.
This shows up in nearly every audit I run. 30 servings on a 30-day plan sounds right until you ask how many days a week people actually take it. Offer two or three frequencies with the right one preselected, and offer skip and frequency change before cancel.
4. The cancel flow
The average cancel flow saves about 1 in 6 people who click cancel. A good one saves 1 in 3. We moved one client from a 14.8% save rate to 29.6%.
Route the offer to the reason. Too much product gets a skip or a longer interval. Price gets a smaller size or a one-time discount. Not working gets a results timeline. Then count a save only if they are still paying 60 days later, or the save rate flatters you.
5. Payment recovery
Some subscribers never decide to leave. Their card declines and nobody wins it back. On one Loop brand, subscribers who updated their card within 30 days recovered 62.0% of failed orders, against 25.8% for those who did not.
Card updater, backup payment methods, retries timed around payday, and a one-tap card update link in the dunning message. A card that declines in month two takes the whole payback with it.
Put together, this is the order we work in. A $5M subscription brand we worked with cut monthly churn from 22% to 9% in 60 days by rebuilding the offer, the delivery frequency and the cancel flow as one system. The Subscription LTV Maximizer builds all five levers inside your subscription app in 30 days.
FAQ
What is a good LTV for a subscription DTC brand?
It depends on price and margin, so judge the curve first. For supplements on a monthly plan, order 3 retention of 62 to 72% is good. In dollars, a 12-month LTV of at least 2.5 to 3 times your CAC is healthy.
How do I calculate subscription LTV in Shopify, Recharge, Skio or Loop?
Pull retention by order number for one monthly cohort from your subscription app, multiply each order's share by gross profit per order, and add orders 1 to 12. Shopify alone can't split subscribers by order, so export orders if your app has no report.
Should subscription LTV use revenue or gross profit?
Gross profit. Take off the first-order discount, product cost, shipping, packaging and payment fees. At 50% margin, revenue LTV is double what you can actually spend on acquisition.
Should I use 12-month or lifetime LTV?
12-month for setting CAC and planning cash. Lifetime LTV rests on a churn rate you are guessing years out, so treat it as a ceiling. Funded brands with long runways sometimes use 24 or 36 months.
Why is my predicted LTV higher than my cohort LTV?
Predicted LTV adds orders that haven't happened and usually assumes churn stays flat. Eightx puts the gap at 20 to 40%. Trust the cohort and check the prediction against it every quarter.
How long before I can trust my LTV number?
A monthly cohort needs about 13 months to show a full 12-month LTV. Before that, read order 3 retention, which you can see in month 3 and which predicts most of the curve.
One email a week on subscription retention: the numbers, the strategy, and what to fix first.

Rahi Jain
Rahi Jain is a subscription LTV specialist who helps DTC brands maximize their LTV from subscriptions.
More about Rahi