
Key takeaways
- Gross margin alone hides the cost to acquire, the conversion rate and the repeat rate of each product. Judge all four together.
- Cost of acquisition comes from Google Shopping or Performance Max reports, grouped by product, brand or category.
- Review the top five products or categories once a quarter, trim the weakest 20%, and push the strongest.
Most brands pick winners by gross margin. After working with 50 plus brands, I have seen that this hides a lot.
A product can have a high margin and still lose money once you count what it costs to win the order and whether the buyer ever returns. Here is the four step analysis I run, and what I do with it.
Why look at products first
Before a retention plan, a conversion plan or any marketing plan, a lot of profit sits at the product level. This work fits the Product part of our PCC framework: product, customer and communication.
Under product, we look at price, AOV, bundles and discounting. We also ask which products make money and which ones only look like they do.

The four data points for each product
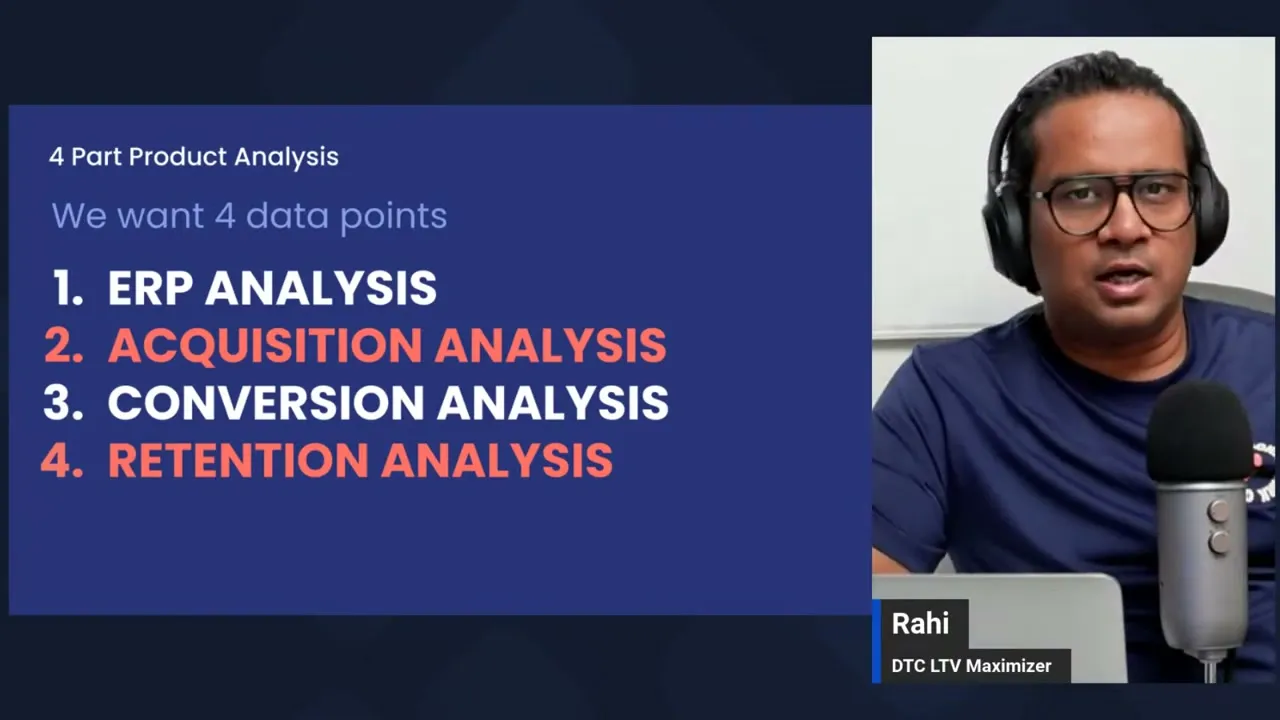
For one product I pull four things. Operations and margin, acquisition cost, conversion, and retention. Any single one can mislead you.
Take gross margin alone. A product may carry a high margin but cost far too much to acquire. Another may convert well on the first sale, then almost nobody buys it again.
1. Operations and margin
I call this ERP on the marketing side. It covers gross margin, returns, and the weight of operations: inventory, delays, manufacturing and defects.
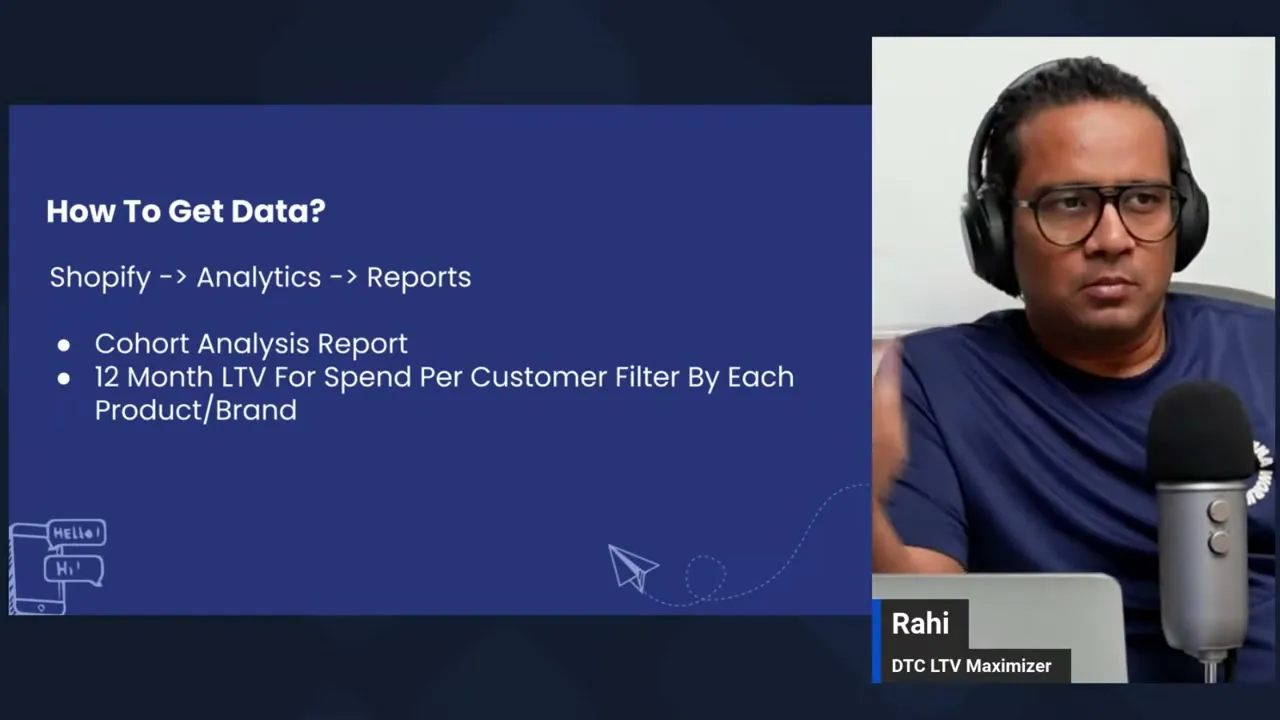
You get most of it from two Shopify reports, sales by product and sales by revenue. This is the easy bucket.
2. Acquisition cost
This is the tricky one. Facebook is hard to break down by product, and Instagram and TikTok do not give the data.
So I use Google. Almost every brand we work with runs Shopping or Performance Max. Group that report by product, brand or category and you get a cost of acquisition for each.
Pick the level that fits the store. A small DTC brand with five or six products works by product. A marketplace works by category. A store in between works by brand or category.
Spend itself matters less than cost per conversion. Say a $50 product has a low cost to acquire and a $200 product has a higher one. The AOV went up four times. Did the cost go up by the same ratio, or by 10%? That tells you which product earns its ad dollars.
3. Conversion
In GA4, the e-commerce purchase report shows views, add to carts and purchases per item. I track two ratios: view to add to cart, and add to cart to purchase.
The first shows how much a product attracts. The second shows how well it closes. A Dyson product is aspirational, so it can get many views and add to carts and still convert poorly. Another product may have few add to carts and a high conversion rate.
These numbers run higher than your store average, because they only count people who saw the product page. They also guide pricing. If a product converts far above the store, there may be room to raise the price by $5 or $10. I then split test it, or compare month on month, and plot conversion at each price.

4. Retention
The first product a customer buys has the largest effect on their LTV. Even after five orders, the first purchase tells you whether they will stay.
So I split LTV by first product. If 50 people bought product A first, what do they do over time? If 50 bought product B first, how do they compare? The gap can be big.
A product may over promise and under deliver. Or it may delight people and make them stick. It may be a $20 or $50 entry product sold at a loss, as a price leader. Or it may be hyper discounted, and the buyers came for the deal and left.
Put it on one sheet
Now put the four buckets in Excel, one row per product, brand or category. Keep it small. Five rows is enough for most brands, and 10 to 15 will cover even a large one. You do not need 100 products.
Columns follow the four steps:
| Bucket | What goes in the columns |
|---|---|
| Operations and margin | Quantity, return percentage, gross margin or COGS, shipping or 3PL cost |
| Acquisition | Clicks, CTR, conversions, average cost per conversion |
| Conversion | Platform conversion, GA4 conversion, add to cart to purchase, view to purchase |
| Retention | LTV from cohort analysis, AOV |
From here you can estimate CAC and a contribution margin per row. Add shipping and 3PL cost and you have a rough P&L by product. The CAC is rough because it comes from Google, but a small sample beats skipping it.

What to do with it
The insight is a choice between remove and fix. It is rarely clean. If one product holds 50% of your revenue and has the worst numbers, you cannot cut it. You have to fix it.
There are no blanket rules either. I would not say to drop every product with 5% returns or under 1% conversion. It depends on the brand and its stage.
The safest move is to promote the weak ones less. We have pulled them from Google feeds and product feeds, and taken them off the homepage. If stock is already on hand, just do not place the next order.
The aim is to change the last 20% of the range, not the whole site. These are the products with low margin, high CAC, high returns, low view to purchase and low LTV.
Then push the winners. These are the hidden gems: good margin, low CAC, few returns, strong conversion and high LTV. Put more video, more influencer work and more ad spend behind them.
How often to run it
Run it once a quarter. Twice a year works too. Every 15 days creates confusion and disruption, and this is a long term game.
It takes two or three hours a quarter. You are steering the range, not swinging a hammer.
If you want a second pair of eyes on your numbers, get a free subscription audit.