Key takeaways
- Across 8 subscription brands RetainUP audited in 2026, the median cancel flow saved 10.8% of people who tried to cancel, counting saves only.
- No cancel flow in the sample reached 25%, the low end of the 25% to 33% range often quoted for a good flow. The best saved 19.3%.
- App dashboards can overstate saves: one Stay AI brand showed 62.5% in the app and 12.5% with abandons removed.
Ask what a good cancel flow saves and you will hear 25% to 33%. We have quoted it too, on our own Optimizer page. Then we open a brand's data, and the number is nowhere near it.
So we measured it. 8 subscription brands we audited in 2026, before we changed anything, counted the same way at each one: saves only, with people who simply closed the page taken out.
What is the average cancel flow save rate?
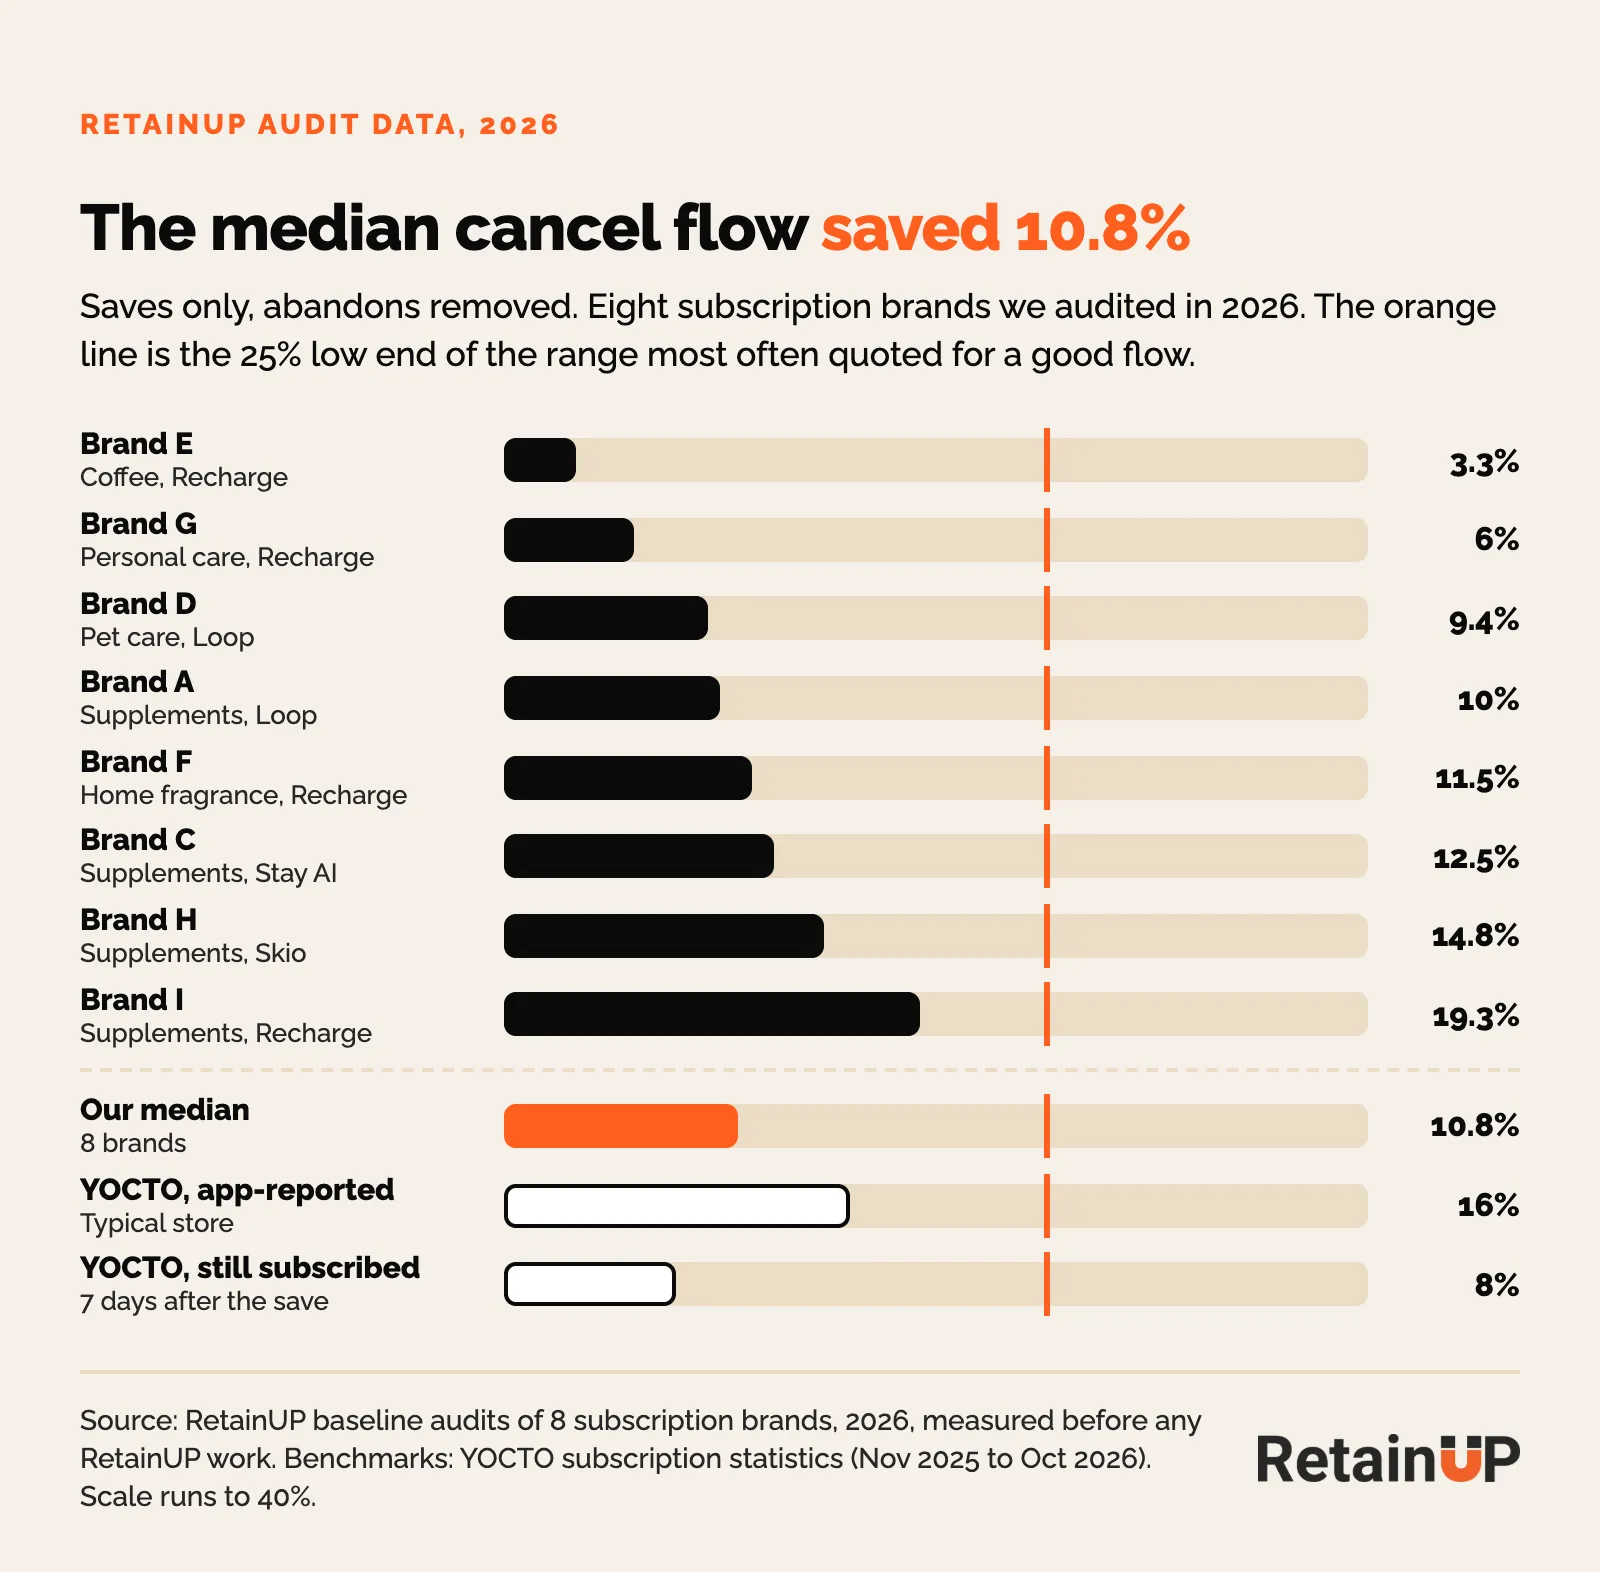
Across 8 subscription brands we audited in 2026, the median cancel flow saved 10.8% of the people who tried to cancel, with a range of 3.3% to 19.3%. That is about 1 in 9. The other 8 walk out.
| Brand | Category | App | Save rate, saves only | Note |
|---|---|---|---|---|
| Brand E | Coffee | Recharge | 3.3% | |
| Brand G | Personal care | Recharge | 6% | |
| Brand D | Pet care | Loop | 9.4% | |
| Brand A | Supplements | Loop | 10% | Most saves cancelled again soon after |
| Brand F | Home fragrance | Recharge | 11.5% | Recharge showed 16.3% |
| Brand C | Supplements | Stay AI | 12.5% | 29,512 sessions. The app showed 62.5% |
| Brand H | Supplements | Skio | 14.8% | 3,507 sessions |
| Brand I | Supplements | Recharge | 19.3% | 74% of save code users ordered again |
| Median, 8 brands | 10.8% | |||
| YOCTO, typical store | Mixed | Mixed | 16% in the app, 8% still subscribed 7 days later | |
| Churnkey, software | 6 software and service categories | Churnkey | 21.1% to 36.4% | Trailing 12 months |
Seven of the eight sat under 15%. The two lowest, at 3.3% and 6.0%, were both on Recharge. The app did not decide the result. Brand I, the best in the sample, was on Recharge too.
How does that compare with the benchmarks?
Our median sits between YOCTO's two published figures: 16% as the apps report it, and 8% when you count only people still subscribed a week later. Both come from YOCTO's subscription statistics, November 2025 to October 2026.
We could not find an ecommerce dataset behind 25% to 33%. The closest published numbers come from software. Churnkey reports its cancel flows saving 21.1% to 36.4% of attempted cancellations across six software and online service categories, over the trailing 12 months. Cancelling a software tool and cancelling a box of gummies are different decisions. Judge your flow against ecommerce numbers, counted your way.
Why do app dashboards show higher save rates?
Some app dashboards count anyone who leaves the flow without cancelling as saved, so closing the tab looks like a save. Others count the save the moment the offer is accepted, before the next order pays.
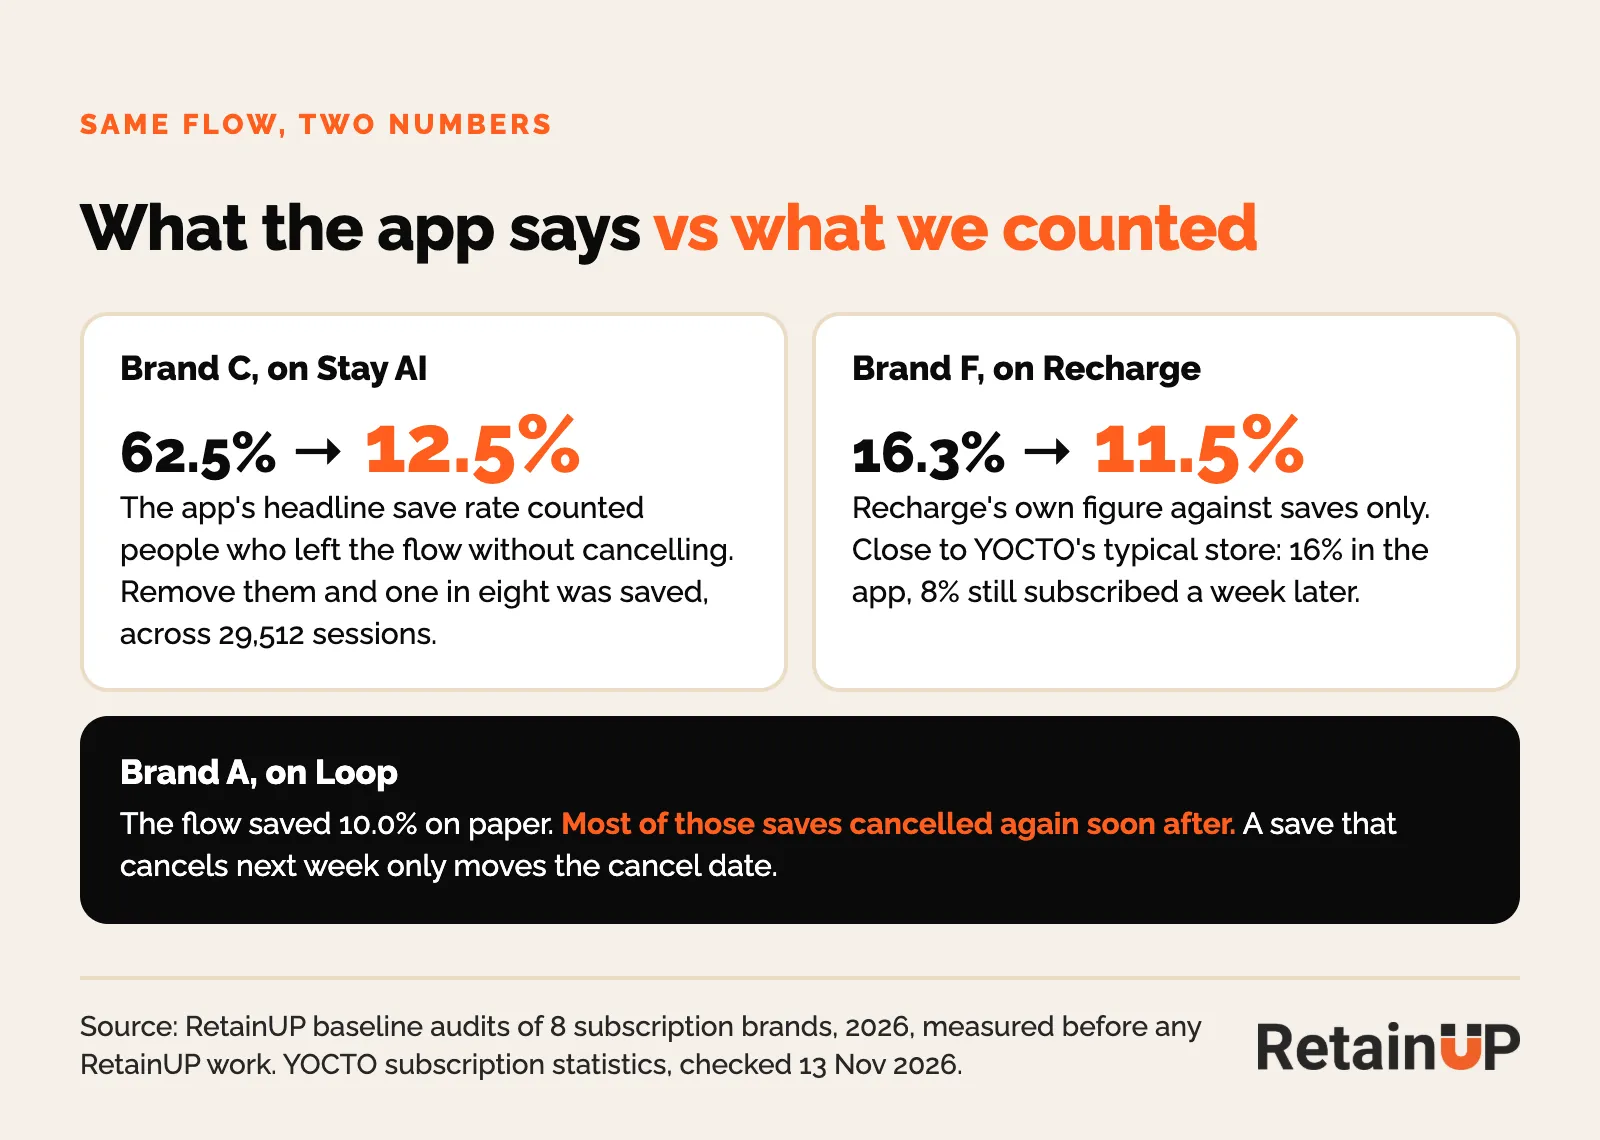
Brand C's app showed 62.5%. With abandons removed it was 12.5%, across 29,512 sessions. Brand F's Recharge figure was 16.3% against 11.5% saves only. At Brand A, most saves cancelled again soon after. Recharge's supplement data shows why the next order matters: subscribers who took an offer placed another order 44% of the time after a skip, 49% after a discount, 53% after a delay and 66% after a swap. A save counts once the next order pays.
Why do most cancel flows save so little?
Most cancel flows save little because many cancels are lost before the page loads, and the rest see one offer that does not fit their reason.
- Some cancels can't be saved at the cancel page. At Brand C, 24.4% of cancellations came from people who never meant to subscribe or thought they had bought once. That fix sits at checkout and in the order confirmation.
- One offer for every reason. The most common setup we open leads with a discount, whatever the subscriber said. "Too much product" needs a skip. "Didn't work" needs a swap or a results timeline. The method is in cancel flow routing.
- Skip and pause come too late. At Brand C, 2% of subscribers ever paused. People who only wanted a break went straight to cancel. The order we use is in the flexibility ladder.
- Nobody reads the answers. Reasons like "Other" and "no reason" hide most of what people say. Our exit survey post covers why price is rarely the real reason.
What did the best cancel flows do differently?
The two strongest flows in our data matched the offer to the reason and gave subscribers something other than money off.
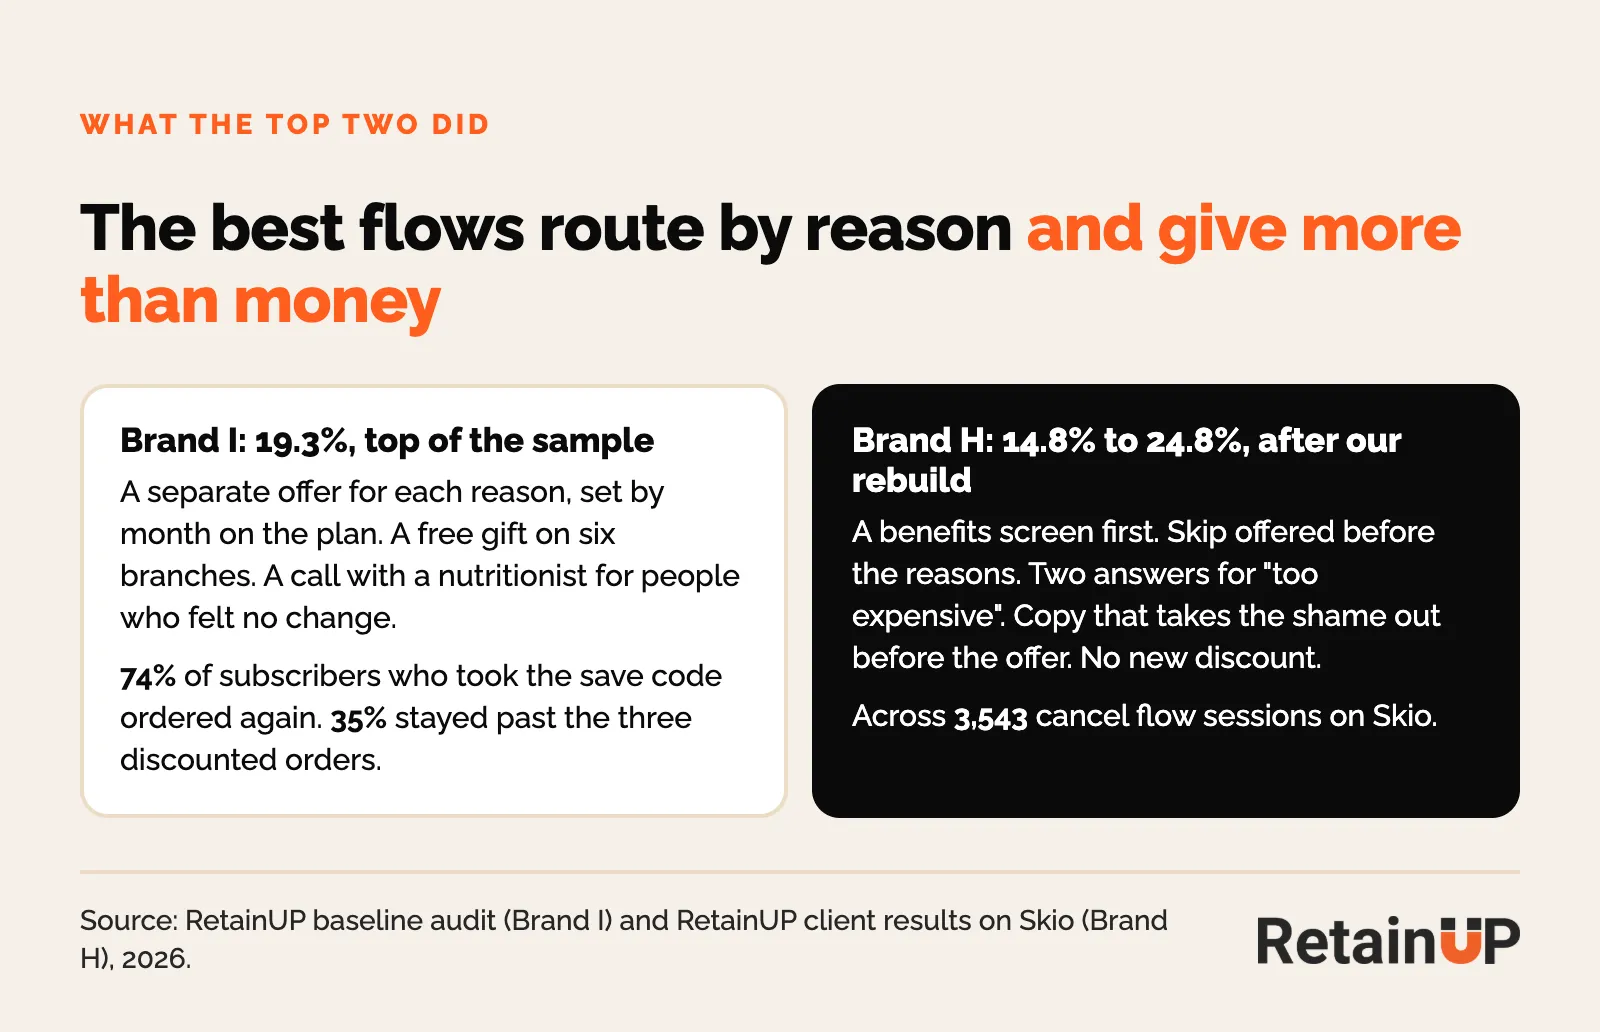
Brand I saved 19.3%, the top of the sample. It set a separate offer for each reason and month on the plan, put a free gift on six branches, and offered a call with a nutritionist to people who felt no change. The saves held: 74% of subscribers who took the save code ordered again, and 35% stayed past the three discounted orders.
Brand H sat at 14.8% when we audited it. After our rebuild on Skio it saves 24.8%, across 3,543 cancel flow sessions, with no new discount. A benefits screen comes first, skip comes before the reasons, "too expensive" gets two answers, and the copy takes the shame out before the offer. The full build is in the cancel flow case study. That 24.8% came after our work, so the median leaves it out.
How we measured it
Every save rate comes from a baseline audit we ran in 2026 on each brand's own cancel flow data, before RetainUP changed anything.
- Sample: 8 Shopify subscription brands audited in 2026. Four supplement brands, plus coffee, pet care, home fragrance and personal care. Apps: Recharge (4), Loop (2), Skio (1), Stay AI (1).
- Period: the months before each audit, in 2025 and 2026.
- Save rate: subscribers who accepted an offer in the cancel flow (skip, pause, swap, delay, discount or gift), divided by subscribers who started the flow. People who left without choosing count as not saved.
- Re-counts: where the app counted abandons as saves, we re-counted from the session export.
- Caveats: eight brands is small, and session counts run from a few hundred to 29,512. We did not track the next paid order after every save, so some saves here later cancelled. Brands that hire us may run low.
- RetainUP has worked with 80+ subscription brands. This dataset is narrower on purpose: only the brands we audited in 2026 with full data, measured the same way.
FAQ
What is a good cancel flow save rate?
Counted as saves only, the median in our 2026 audit data was 10.8% and the best was 19.3%. Above 15% beat seven of the eight brands we measured. Then check how many saved subscribers pay the next order.
What is the average cancel flow save rate for Shopify subscription brands?
Across 8 brands we audited in 2026, the median was 10.8%. YOCTO puts the typical store at 16% as the app reports it, and 8% counting people still subscribed 7 days later.
Where does the 25% to 33% benchmark come from?
We could not find an ecommerce dataset behind it. Churnkey's software cancel flows save 21.1% to 36.4%. None of the 8 ecommerce brands we audited reached 25% before changes.
Why does my app show a higher save rate than my own count?
Many dashboards count people who close the flow without cancelling as saved. One brand's app showed 62.5%. Saves only, it was 12.5%.
Which save offer works best?
The one that matches the reason. In Recharge's supplement data, 66% of subscribers who took a swap placed another order, against 44% after a skip. Our top flow paired offers with reasons and used gifts and a nutritionist call, as well as discounts.
Does a cancel flow reduce churn?
Yes, at the margin. The median flow in our data saves about 1 in 9 people who try to cancel. Most churn is set earlier, at checkout and in the first weeks. See when subscribers cancel.
More from our 2026 audit data
Three posts from the same 2026 audit set, plus the retention bands we use.
- Subscription churn by order number: where subscribers drop off
- Failed payment recovery rate benchmark: data from 8 subscription brands
- What's a good subscription retention rate?
Want to know what your cancel flow really saves? The Subscription LTV Roadmap™ reads every cancel reason, the offer each one gets and your save rate month by month, then gives you the fixes in order, for $1,000. Or start with the free subscription audit.
One email a week on subscription retention: the numbers, the strategy, and what to fix first.

Rahi Jain
Rahi Jain is a subscription LTV specialist who helps $1M to $10M DTC brands reduce subscription churn and maximize LTV on Recharge, Skio, Stay AI and Loop.
More about Rahi