Key takeaways
- Purchase take rate is subscription starts over orders that were not a recurring charge. Counting rebills turned one brand's 44.5% into 60.4%.
- Customer take rate is new subscriptions over first-ever customers. On a healthy program the two cuts land within a point or two, like 44.5% and 45.0%.
- One brand hid one-time options and take rate went from 42% to 58%. Revenue a day fell 42% in the same three days.
Take rate is the share of your buyers who choose subscription. And almost every dashboard I open gets it wrong. It divides by the wrong thing.
This page sits in the Subscription Metrics hub, and it covers one job: how to calculate the number so it means something. How to raise it lives in the take rate guide.
It matters because take rate applies to every single person who buys. Order-three retention applies only to the people who got that far. So in a young base, a take rate fix touches everyone who walks in, while a retention fix touches a slice. Take rate moves this quarter. Churn moves next year. The worked numbers on that are in take rate, retention or acquisition: what to fix first.
The subscription take rate formula, in two cuts
We report it two ways in every audit. They answer different questions.
Purchase take rate
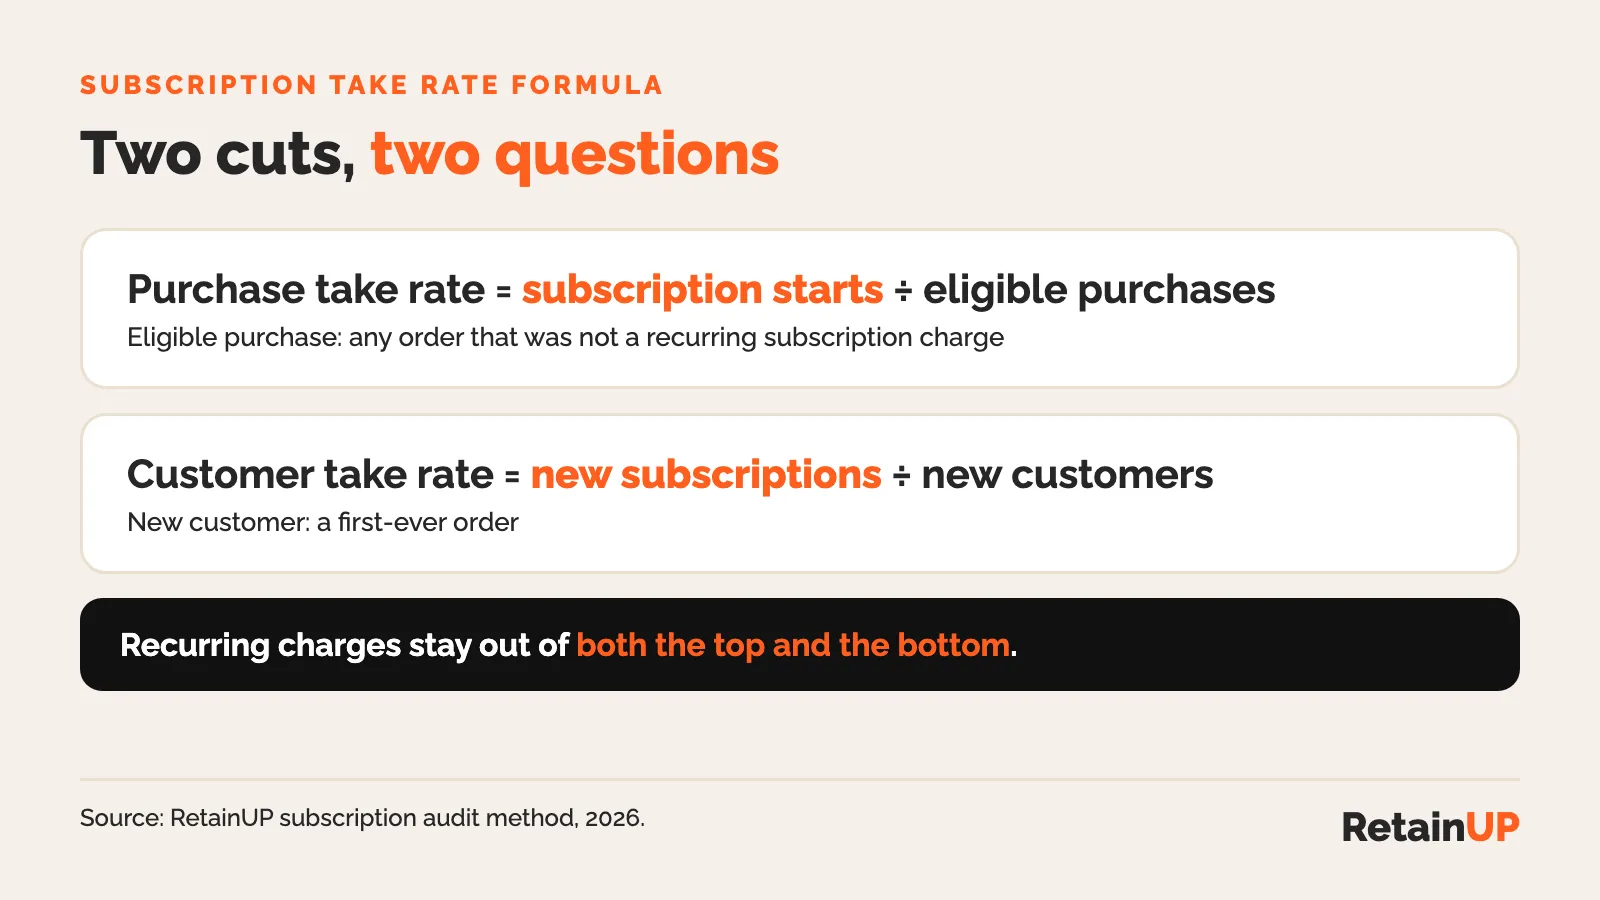
Purchase take rate = subscription starts ÷ eligible purchases.
An eligible purchase is any order that was not a recurring subscription charge. So a one-time order counts. A first subscription order counts. A rebill does not. This cut answers: of the orders where someone made a choice, how many chose subscribe?
Customer take rate
Customer take rate = new subscriptions ÷ new customers.
A new customer is a first-ever order. This one answers a narrower question. Of the people buying from you for the first time, how many started a subscription?
Put both in one monthly table. Twelve months, always. One brand's take rate slid from 33.6% in January to 16.8% in July 2026. A single yearly figure hides a slide like that.
| Column | What goes in it |
|---|---|
| Month | Order month, last 12 months |
| Eligible purchases | Every order that was not a recurring charge |
| Subscription starts | First orders of a subscription |
| Purchase take rate | Subscription starts ÷ eligible purchases |
| New customers | First-ever orders |
| New subs | Subscriptions started by those new customers |
| Customer take rate | New subs ÷ new customers |
Take rate vs revenue share, conversion rate and app dashboards
Search "take rate" and half the results are about fees. On a marketplace, take rate is the cut the platform keeps. Different number. And even subscription apps put the name on different cuts. Check which one you are reading before you compare.
| Number | Formula | Base |
|---|---|---|
| Purchase take rate | Subscription starts ÷ orders that were not a recurring charge | New demand only |
| Customer take rate | New subscriptions ÷ first-ever customers | First orders only |
| Skio checkout take rate, Recharge Benchmarks | Checkout orders with a subscription ÷ all checkout orders | Checkout orders |
| Subscription revenue share | Subscription revenue ÷ total revenue | Includes every rebill |
| Subscription conversion rate | New subscribers ÷ sessions | Traffic |
Revenue share gets mixed up with take rate the most. Recharge now shows it on the Home page. It counts every rebill, so it climbs as the base ages. Loop's NutriPaw case shows how far apart the two run. First-time subscription orders went from 4% to 18 to 20% once subscribe and save became the default. Subscription revenue went from 5% to 28.6% of the total (Loop).
Conversion rate is the third. We read it as new subscribers per 100 sessions. It sits next to take rate whenever an offer changes. Take rate alone can rise while fewer people buy.
Keep recurring charges out of both sides
This is the mistake I see most. Exclude recurring charges. Top and bottom.
A recurring charge was never a decision. Nobody stood on your product page and picked it. Count it, and you are measuring your existing base rebilling, not new demand converting.
On one of our brands, the same five months read 60.4% with recurring orders included and 44.5% without. On another, an audit figure of 23.5% came down to 12.6% once renewals were taken out.
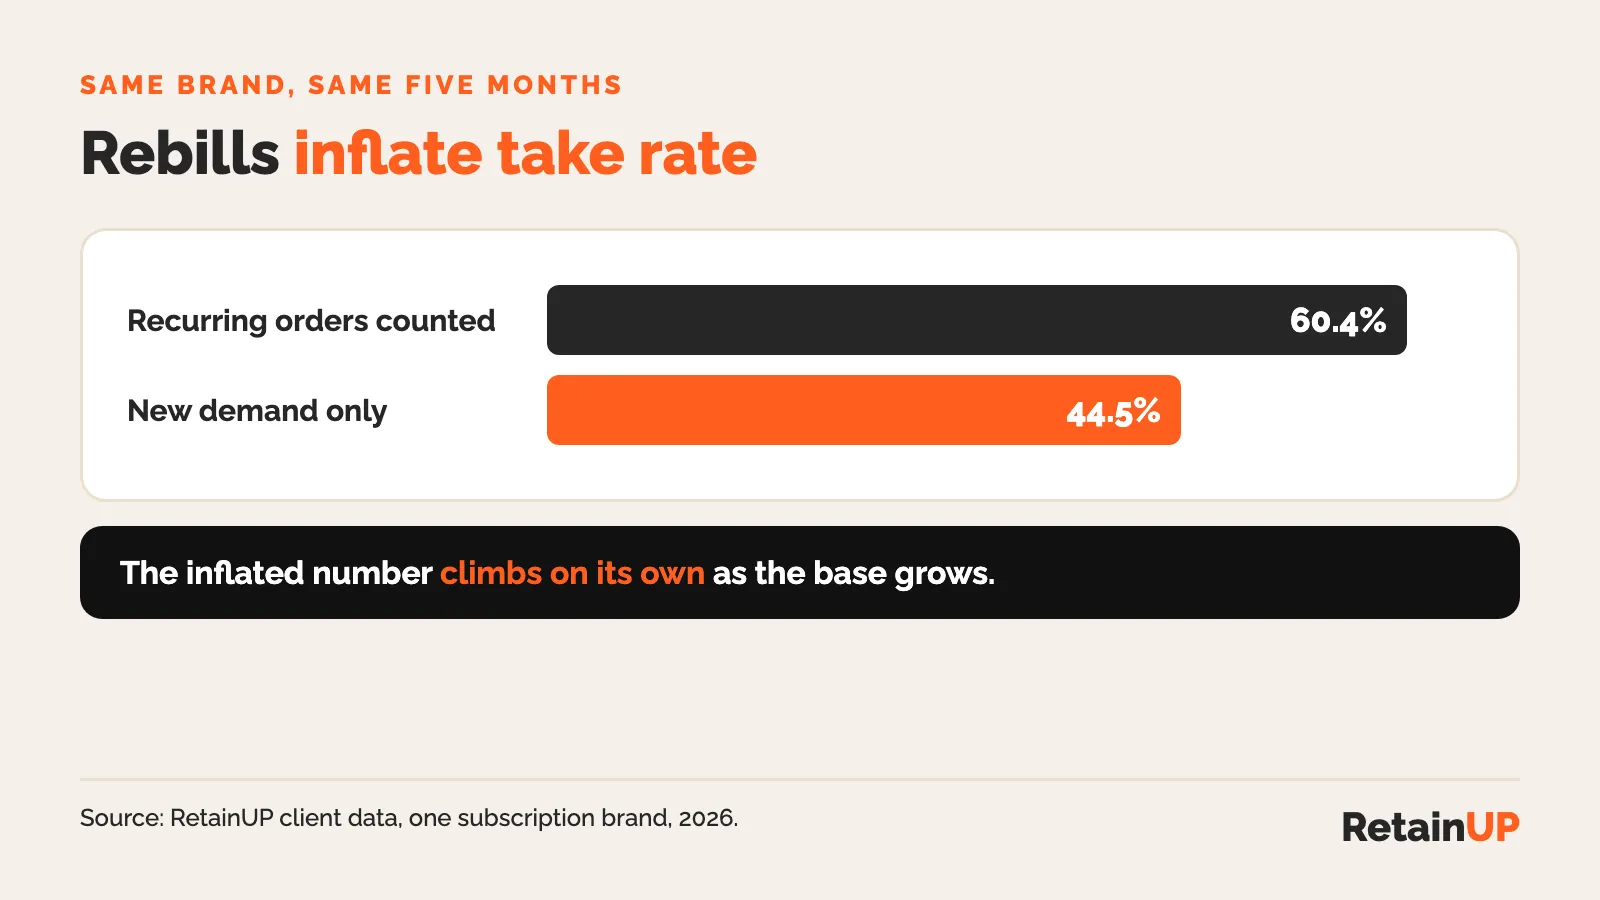
And the inflated version has a worse habit. It climbs on its own as the base grows, which flatters a program that is not improving at all. If your take rate goes up every month and nobody touched the page, check this first.
Old numbers need restating, too. One brand's earlier audit reported 60.3%, computed on all orders. It cannot sit next to another brand's purchase take rate until it is redone.
Split take rate by channel before you quote one number
A blended take rate is a channel mix, not a measurement.
One of our brands read 44.5% blended. On its own store, 67.0%. On TikTok Shop, 19.5%. And TikTok Shop cannot carry a subscription at all. Another brand read 31.7% blended with Amazon, and 61.5% on its own store.
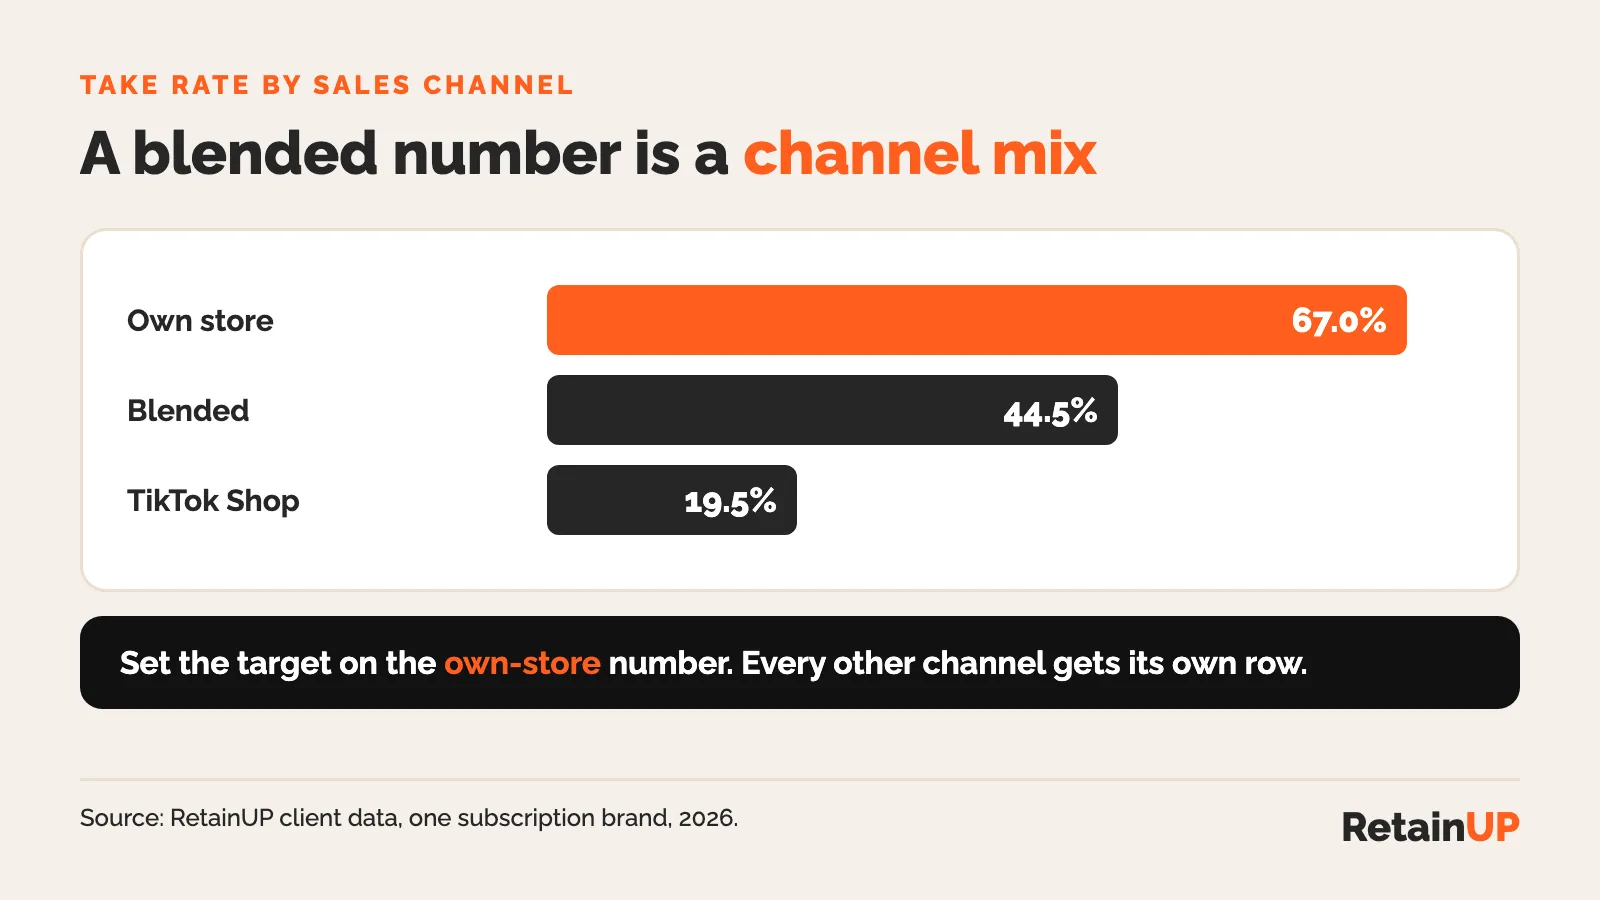
So TikTok Shop, marketplaces and draft orders each get their own row. Set the target on the own-store number, since that is the only one your widget and page can move.
When the two cuts disagree
The two cuts should agree closely. Where almost every subscriber starts on their first order, they land within a point or two. One of our brands sits at 44.5% purchase and 45.0% customer.
A wide gap means one of two things:
- A large base of repeat one-time buyers, who sit in eligible purchases but are not new customers.
- Subscribers converting on a later order, after buying one-time first.
Both are worth naming. And sometimes the gap is the whole story. On one brand, order take rate stayed flat near 67% while customer take rate fell from 67.7% to 50.5%. Report only the first and you would say nothing changed.
When the gap is big, split subscribers by source, counting each customer once:
- Subscribed on the first order
- Bought one-time first, converted later
- Reactivated after cancelling
- Upgraded, or holding more than one subscription
Add 90-day value for each bucket. That tells you whether later converters are worth chasing with a replenishment flow.
A third cut: repeat customers on subscription
One more number worth a row. Of customers with two or more orders, what share are on a subscription?
Bold looked at Shopify stores for its rePete app. For most replenishable brands, only about 20% of repeat customers were on a subscription. Another 55 to 60% reordered on their own, with nothing managing them. No sample size was given, so read it as a direction. But if your repeat buyers look like that, the later-converter bucket above is where the take rate is hiding.
Where to pull the data
Pull it from the Shopify order export, line-item level, with tags and email. Not the subscription platform. Not summary reports either.
Your subscription app cannot do this alone. As Polar Analytics points out, the app sees a signup with no order history. So a customer who bought one-time twice looks brand new. The Shopify export sees both.
Subscription orders carry an order-level tag that separates a first order from a recurring charge. So both cuts come out exact. Reconcile the recurring count against the platform before you present anything. Summary reports cannot be cut by tier or by day after the fact.
Check the export has a usable customer key. One brand's export arrived with every email redacted to the word "blocked". The customer ID survived and matched the subscription app on every row, so the join held.
What Recharge and Skio show you
Recharge has a Benchmarks page in the admin (Home > Benchmarks). It shows your take rate percentile against your vertical, and it measures the share of checkout orders with a subscription. That is a different base from either cut above, so read its medians against your own number on the same definition. For beauty and personal care, the median was 8.3% of checkout orders, Nov 2025 to Oct 2026. Screenshot it for every audit. Skio's Overview dashboard has a checkout take rate on the same base, with a daily trend line. Every other median is on the subscription benchmarks page.
Take rate bought with a discount vs earned with a clearer offer
One caution before you go raise the number.
Take rate bought with a deeper discount is a different number from take rate earned with a clearer offer. Past 20% off you are buying a price anchor. You cannot sustain it.
You can cheat take rate. It jumps from 30% to 50% when the discount goes from 10% to 25%. On a report that looks great. But the customer is not paying you more, and some are paying less.
The case where take rate went up and the brand lost money
For most subscriptions we believed we could move take rate to 70 to 80% by suppressing one-time purchase. So we did. On one brand, subscription became the main offer, a few free gifts went on, and the one-time multi-pack options came off the page.
Take rate went from 42% to 58%. Most chose a quarterly plan. I was happy for about a day.
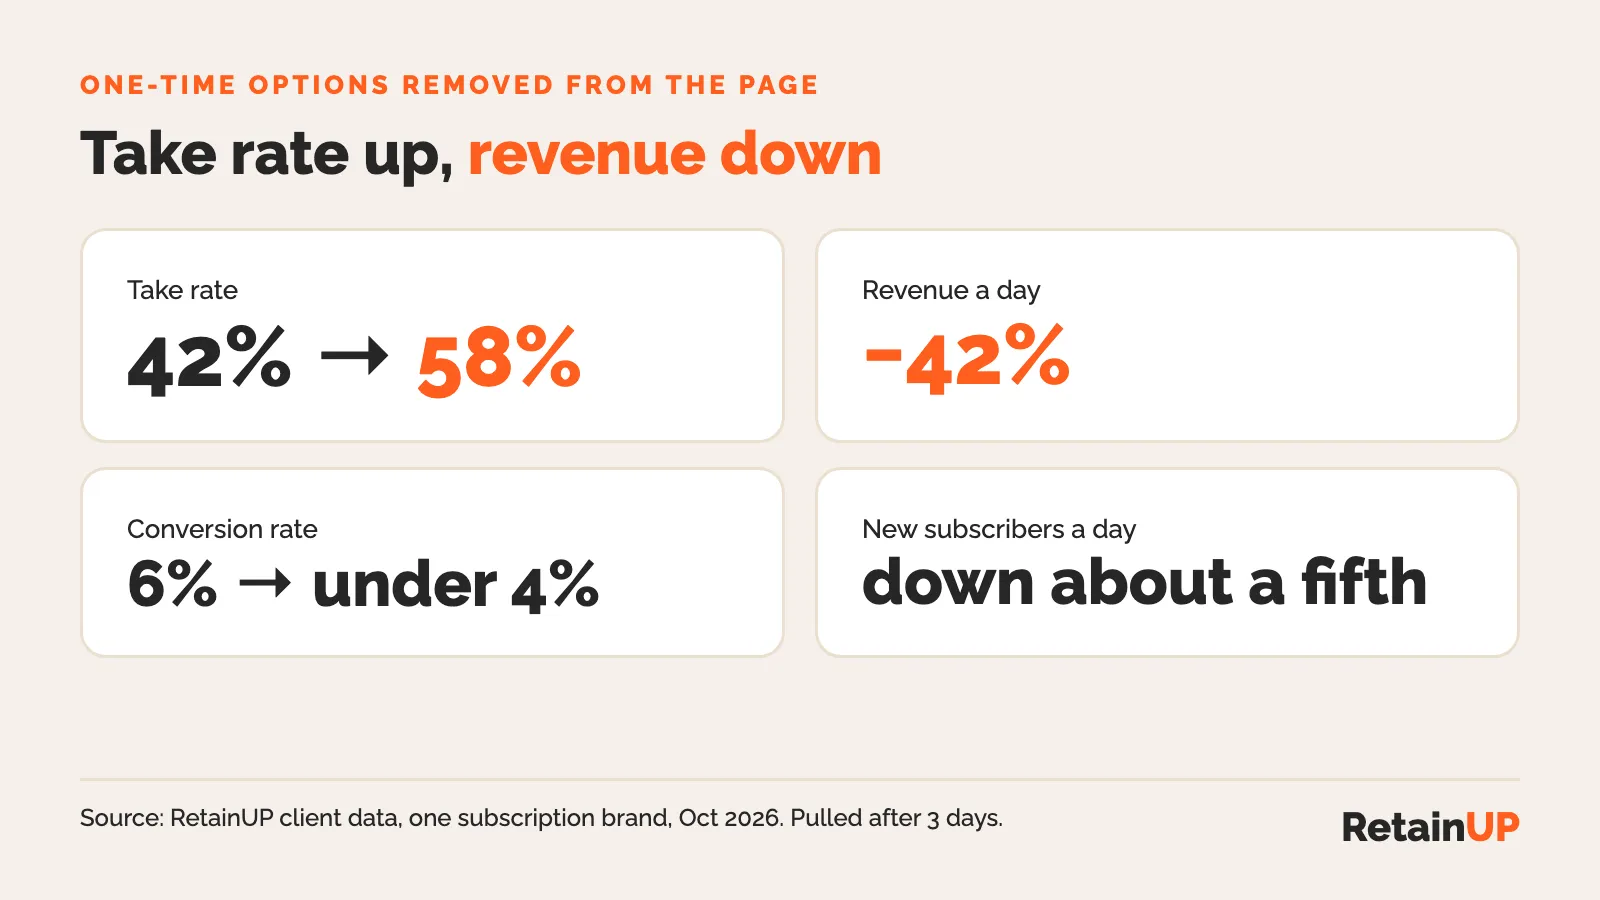
Then the rest came in. Conversion fell from 6% to under 4%. Revenue a day fell 42%. New subscribers a day dropped by about a fifth. For every one-time buyer who switched to subscription, about nine left. Orders were already sliding the days before, and we had no session data, so part of that drop may be traffic. One thing did improve. Same-day cancels fell from 10.6% to 4.6%. So the new buy box fixed the "didn't know it was a subscription" problem. We still pulled the offer after three days.
Suppressing one-time has worked for a lot of brands. But moving buyers from one-time to subscription needs more than hiding the options. You have to rework the bundles and the pricing, so the first order barely moves.
So we never judge an offer change on take rate alone now. Judge it on revenue per visitor and new subscribers per 100 sessions, read by day, before and after. Before the change, model it on current inputs and show the headroom: how far orders can fall before revenue is flat.
And state the renewal rate that pays back the gap. First-order value falls as subscription share rises, and that is fine if orders hold. On that brand, a $89.95 subscriber beat a $104.95 one-time buyer once about 17% of them paid a second time.
Read take rate by tier, too
Take rate by tier is the check nobody runs. One brand converts 53.1% on one tub and 66.0% on two, then falls back to 59.7% and 59.0% on three and four. Buying more does not mean subscribing more. So the deepest discounts were not buying subscription commitment. Split on whatever the offer flexes: frequency, pack size, tier or product line. More on setting the rate in how much to discount a subscription.
What earned take rate looks like
IM8 converts 79% of new customers to subscription on the first order. The 90-day supply at 30% off is selected when the page loads, the welcome kit only comes with subscription, and one-time purchase is a single underlined link under both plans.
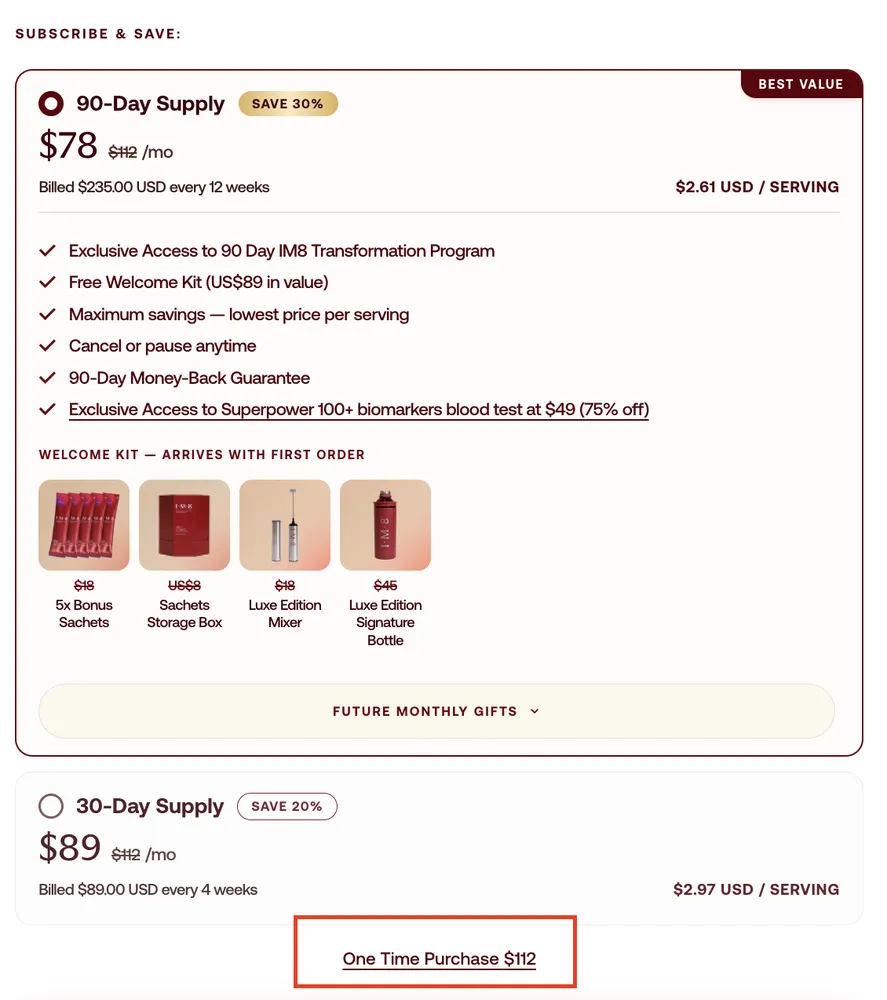
Defaults work. Ordergroove found pre-selecting subscription lifts enrolment by up to 195%. The cost shows up later, as a bigger charge-day cancel spike from people who did not realise they subscribed. That trade is priced in cancellation day spikes.
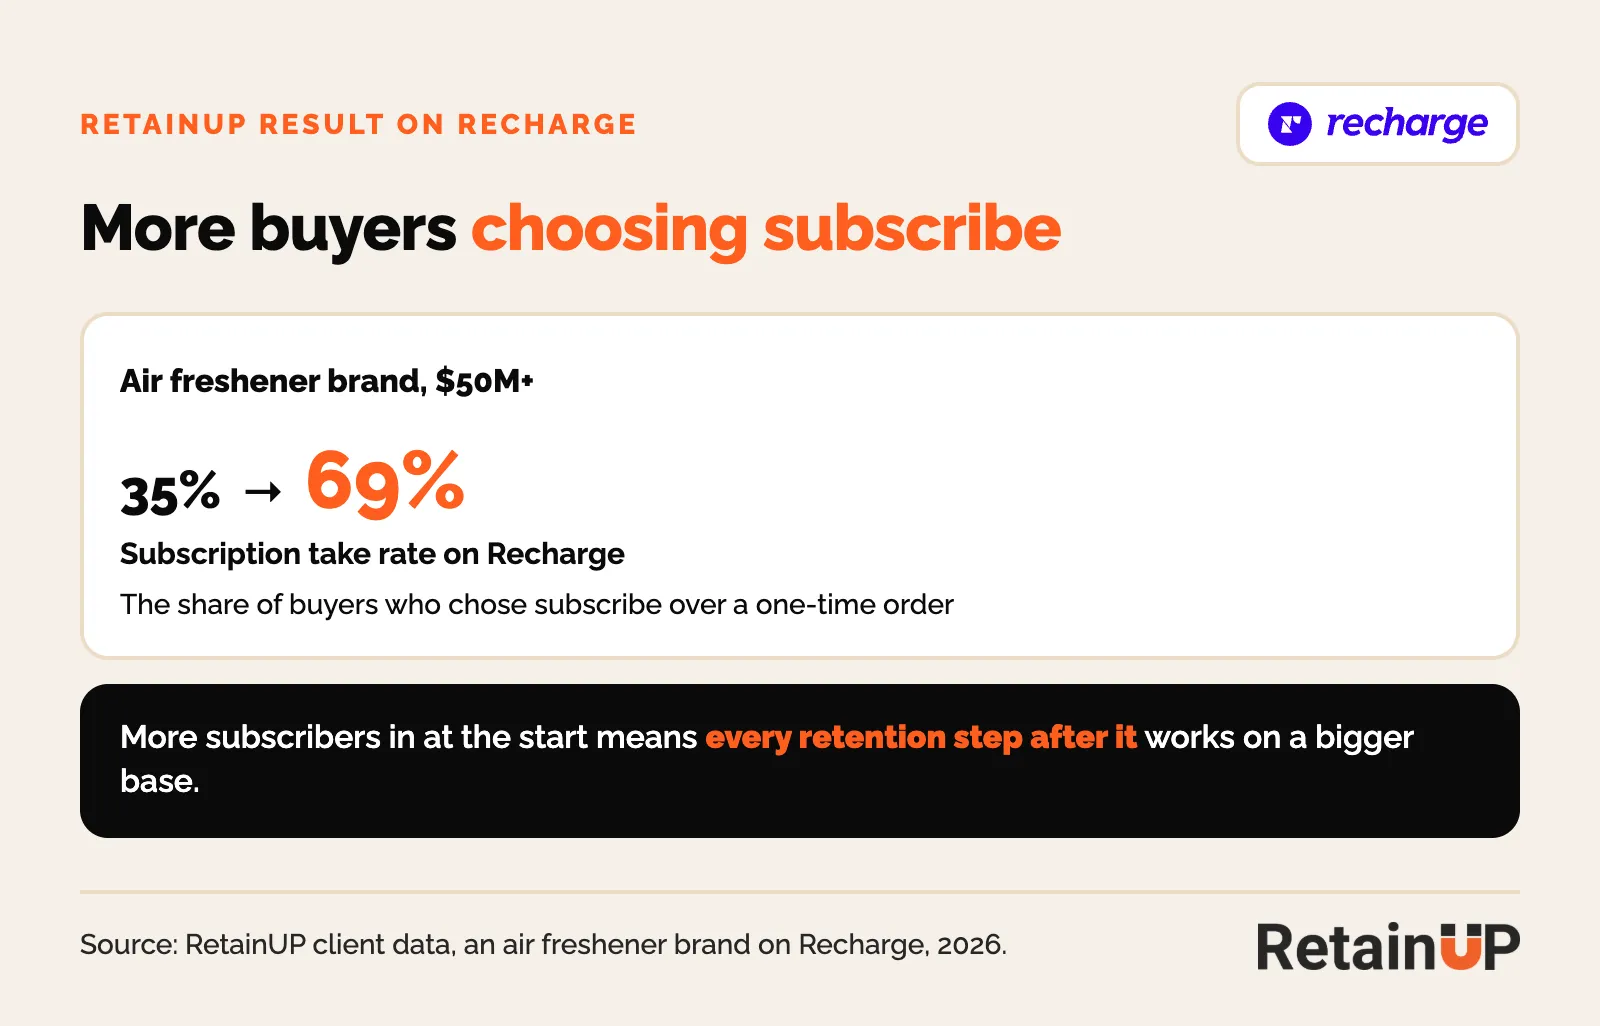
One more. An air freshener brand on Recharge went from 35% to 69% take rate with us, and every retention step after it works on a bigger base.
Another agency raised the one-time price and shipping instead of cutting the subscription price, and take rate moved from 25 to 30% up to 57%. The subscription got relatively better without getting cheaper.
What the number tells you to do next
Take rate on your own store, new orders only, decides where the work starts. 40% is a working floor for a single-product brand, and 60 to 70% is realistic once the product page widget, page and journey are built.
- Under 40%: lead with take rate. You are running a store with a checkbox.
- Inside the band: the value sits in retention. Track Order 3 retention next.
- Over 80%: stop spending on one-time conversion. One brand at 89.4% was better off putting gifts on the longer plan.
And keep it next to the money. A take rate that rises while 12-month LTV stays flat means you bought it.
If you want both cuts run on your own Shopify and subscription data, by channel and by tier, that is the first read in the Subscription LTV Roadmap™: a read of your subscription data, then a 90-day plan of 30 to 50 changes in order, in 3 working days, for $1,000.
FAQ
How do you calculate subscription take rate?
Divide subscription starts by eligible purchases, where an eligible purchase is any order that was not a recurring subscription charge. That gives purchase take rate. For customer take rate, divide new subscriptions by new customers, meaning first-ever orders. Report both monthly over the last 12 months, on your own store only, from the Shopify order export rather than a dashboard total.
Should recurring orders count in take rate?
No. Leave recurring charges out of both the top and the bottom of the formula. A rebill was never a decision, so counting it measures your base renewing rather than new buyers choosing subscription. One brand read 60.4% with recurring orders and 44.5% without, on the same five months, and the inflated version keeps rising as the base grows.
What is the difference between purchase take rate and customer take rate?
Purchase take rate looks at every order where someone made a choice, including repeat one-time buyers. Customer take rate looks only at first-ever customers. On most programs they sit within a point or two. A wide gap means a big repeat one-time base or subscribers who convert on a later order. Each needs a different fix.
What is a good subscription take rate?
It depends on the base. On new own-store orders, 40% is a working floor for a single-product brand, and 60 to 70% is realistic once the widget, page and journey are built. Most health brands treat 40 to 50% as a win. IM8 converts 79% of new customers on the first order. Recharge's 8.3% beauty median counts all checkout orders, so it is a different number.
Is a higher take rate always better?
No. Not when it was bought. A deeper discount or hiding one-time options can lift take rate while revenue falls. One brand went from 42% to 58% after removing one-time packs. Revenue a day dropped 42%. Judge any offer change on revenue per visitor and new subscribers per 100 sessions, alongside take rate.
One email a week on subscription retention: the numbers, the strategy, and what to fix first.

Rahi Jain
Rahi Jain is a subscription LTV specialist who helps $1M to $10M DTC brands reduce subscription churn and maximize LTV on Recharge, Skio, Stay AI and Loop.
More about Rahi