Key takeaways
- In one worked example at $27 gross profit per order, the simple churn formula gives $338 while the cohort paid $137 in 12 months.
- Klaviyo, Lifetimely and Yotpo predicted LTV often runs 20 to 40% above actual cohort LTV, according to Eightx.
- Recharge's 2026 Trend Report, across 20,000 brands, finds subscribers placed nearly 3x more orders than one-time shoppers.
Ask a founder for their subscription LTV and you get a number in about two seconds.
Ask how they got it and it is nearly always the same sum. Monthly revenue, times margin, divided by the churn rate on the app dashboard. Sometimes it is the predicted LTV from Klaviyo or Lifetimely, which is worse.
I open 10 to 20 cohort charts a month across different brands. The number the founder quotes is almost always higher than the cash the cohort actually paid. Often twice as high.
So this page is the formula only. It sits in our subscription metrics hub. The fixes live elsewhere.
What 12-month subscriber LTV means
12-month LTV is the gross profit a subscriber cohort pays you in its first 12 months, counted from the first paid subscription order. Not the predicted kind. The cash a cohort actually paid. Nobody can game that, because it already happened.
Most founders treat LTV as a trophy number. It is a budget number. It tells you what you can pay to acquire a subscriber and still make money.
- Gross profit, not revenue. After the first-order discount, refunds, product cost, shipping, packaging and payment fees. Eightx puts returns alone at 5 to 15% of revenue. A $45 order at 60% margin is $27, and $27 is the number you work with. One blended margin across products overstates LTV by 10 to 20%.
- A window. 12 months for cash decisions. Eightx gives the same split: 12-month LTV for cash, 24-month for strategy, and lifetime LTV as theoretical.
- Subscribers, not customers. Keep one-time buyers out of it. Blend them in and one big acquisition month moves the number more than anything you changed.
Why 12 months and not 60 days or 36
A 60-day window is too short. It catches the first order and, at best, the first repeat. A 24 or 36-month window is too speculative for cash decisions.
Grüns measures LTV as fully burdened gross profit over 36 months, divided by CAC. But Grüns was funded and had high velocity. It could wait 36 months for the money. A brand funding growth from its own cash cannot. That is why we use 12 months. For lower-frequency categories like home goods, Northstar uses 24.
The simple formula, and where it comes from
The formula most guides give is LTV = monthly gross profit ÷ monthly churn. Here it is in four steps, with a subscriber worth $45 a month at 60% margin.
| Step | Sum | Result |
|---|---|---|
| 1. Lifespan | 1 ÷ 15% monthly churn | 6.7 months |
| 2. Monthly gross profit | $45 × 60% | $27 |
| 3. LTV | $27 × 6.7 months | $180 |
| 4. Max CAC at 3:1 | $180 ÷ 3 | $60 |
Ecommerce guides often write it as AOV × purchase frequency × gross margin × lifespan. On a monthly plan the frequency is one order a month, so it comes to the same sum.
It is a fine sketch. I use it myself to show founders how much a few points of churn are worth. Same product, same margin, and look what churn alone does.
| Monthly churn | Lifespan | LTV | Max CAC at 3:1 |
|---|---|---|---|
| 15% | 6.7 months | $180 | $60 |
| 8% | 12.5 months | $338 | $113 |
| 5% | 20 months | $540 | $180 |
LTV went from $180 to $540. Your ad ceiling went from $60 to $180. Most brands chase a cheaper CAC. The bigger lever is churn. A good LTV to CAC ratio is 3:1 to 4:1, on 12-month gross profit. At 2:1 you break even and it is fragile. The bands and the payback math are in CAC payback and LTV to CAC.
The trouble starts when that sketch becomes the number you set CAC with. For that you need the cohort.
How to calculate 12-month LTV by cohort
Take everyone who placed their first paid subscription order in the same month. Count what share of them paid each order after that. Multiply each share by your gross profit per order, and add it up to order 12. That is 12-month LTV per starting subscriber, made only of money that already arrived.
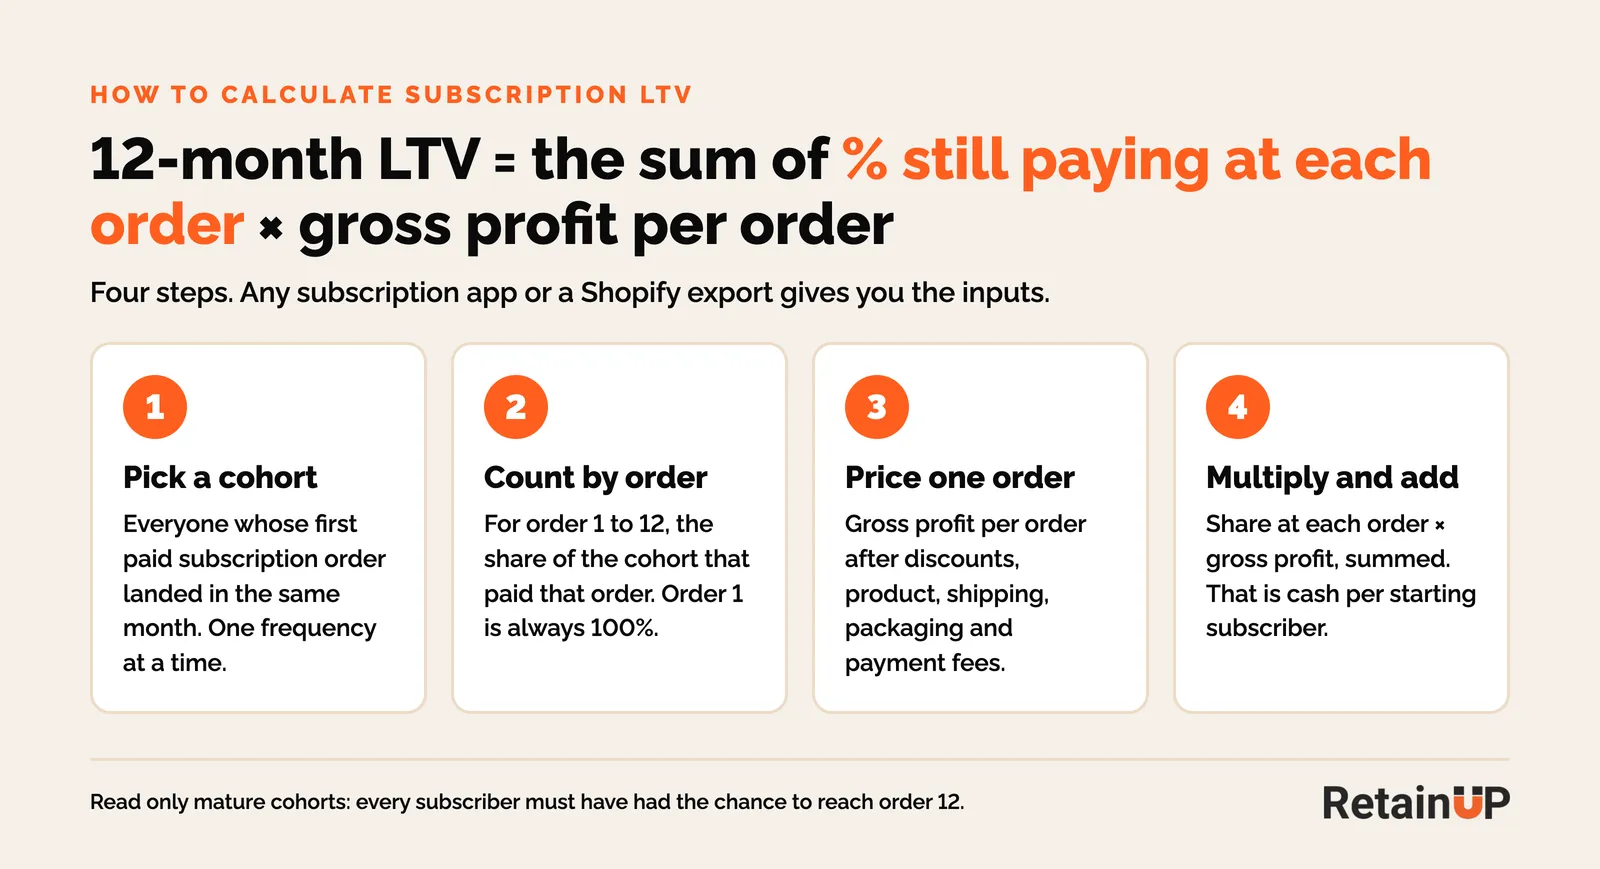
12-month LTV = Σ (share of the cohort that paid order n × gross profit per order), for n = 1 to 12
- Pick a cohort. Everyone whose first paid subscription order landed in March, say. One frequency at a time: a quarterly subscriber at month three has paid once, a monthly one three times.
- Count by order, not by month. Order 1 is always 100%. Then the share that paid order 2, order 3, and so on.
- Price one order. Gross profit after discounts, product, shipping, packaging and payment fees. If later orders carry a different price, use each order's own figure.
- Multiply and add. Share at each order × gross profit, summed to order 12.
Worked example: 400 March subscribers
A supplement at $45 a month, 60% margin, so $27 of gross profit per order. 400 people placed their first paid subscription order in March. Here is what they did.
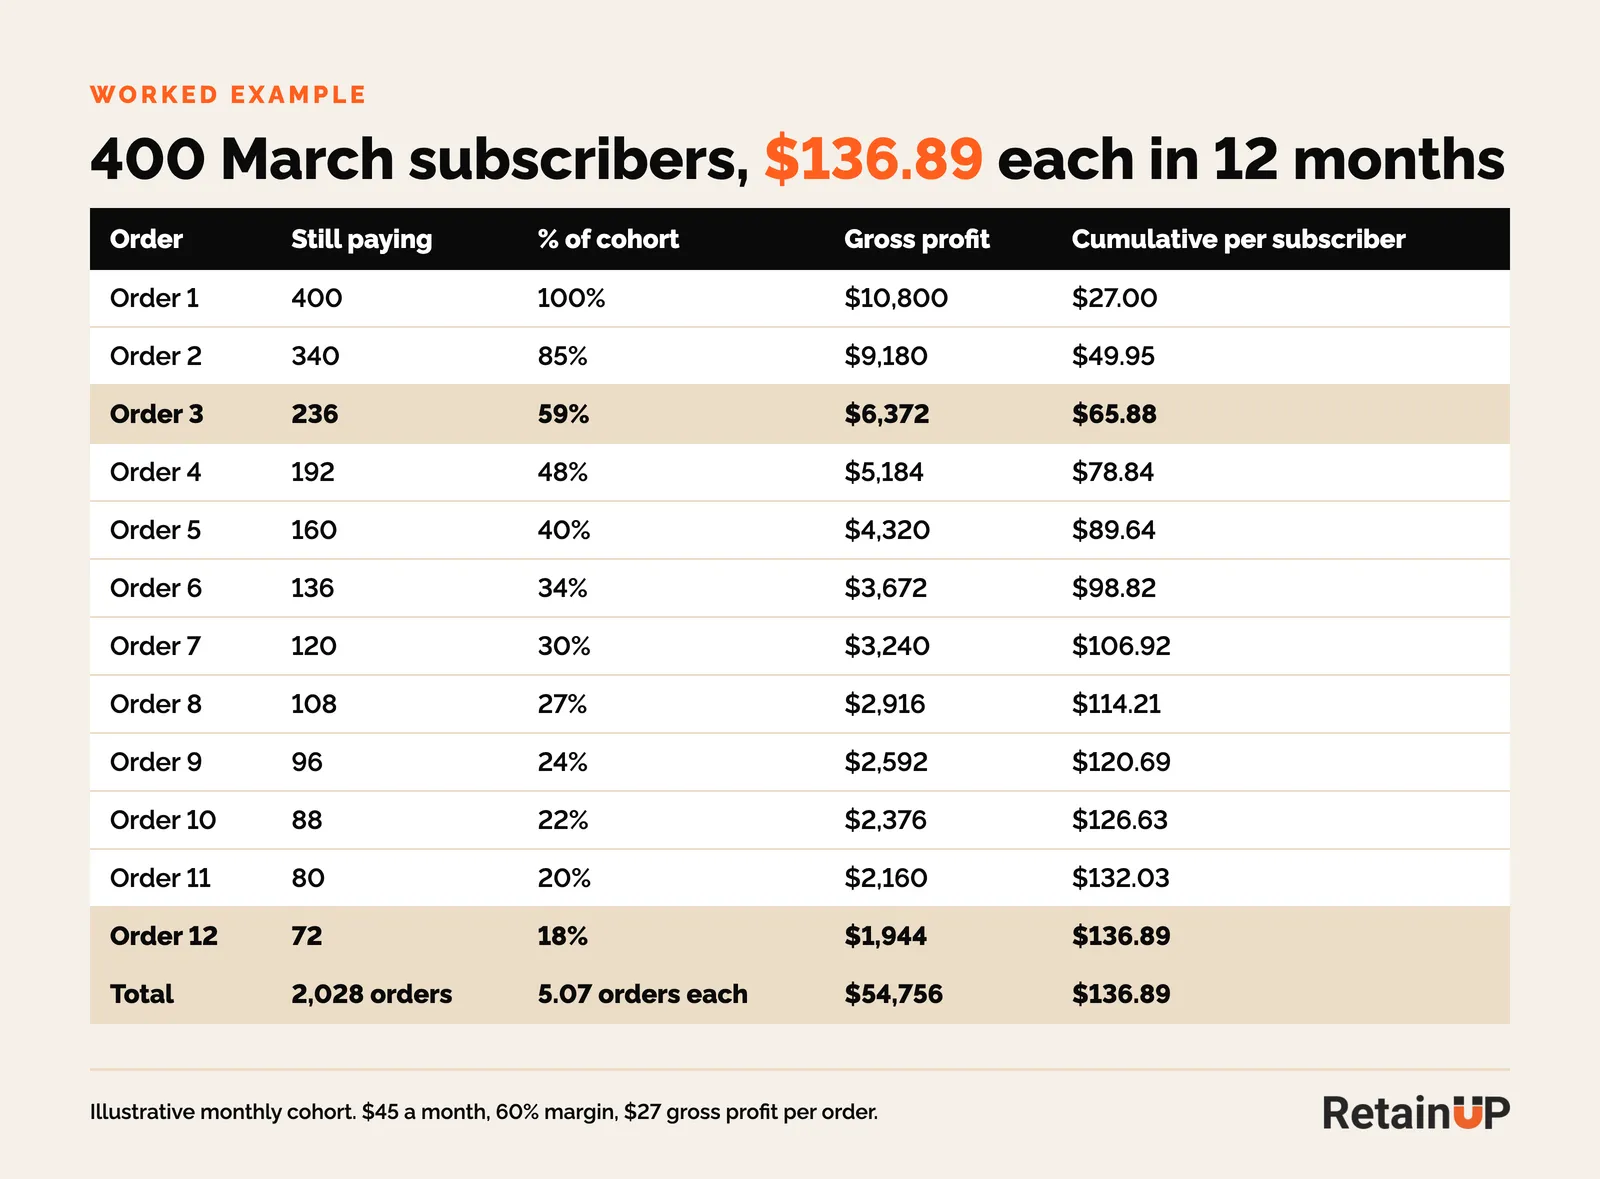
236 of 400 paid order 3, so order 3 retention is 59%. By order 12, 72 are left. Across the 12 orders the cohort placed 2,028 orders, 5.07 per starting subscriber.
So divide the cohort's gross profit by the 400 who started, not the 72 still paying, and you get $136.89. That is the 12-month LTV.
Two rules before you trust your own version
Only use mature cohorts, where every subscriber has had the time to reach order 12 plus about 30 days for skips and payment retries. So a monthly cohort needs about 13 months. A younger cohort's blank cells mean not known, not zero.
And leave failed payments still in retry out of the count until they resolve. Not paid. Not gone either. How to split those out is in active vs passive churn.
Where to pull the numbers in your app
| App | Where | Watch for |
|---|---|---|
| Skio | Analytics, Cohort Dashboard, Retention by order count | Switch the toggle to Subscribers, not Subscriptions |
| Loop | Analytics, Cohorts, Order-Level view | Filter by delivery frequency and read each plan on its own |
| Recharge | Analytics, Subscription Journey, Subscription Retention by Order Number | Check it shows survival from order 1, not step rates from one order to the next |
| No report | Export subscription orders from Shopify | Drop $0 orders, number each customer's orders by date, group by month of order 1 |
Skio and Loop also print an LTV figure. Both are revenue. Skio's cohort LTV is subscription revenue divided by cohort size, per its help centre. Loop's Average Subscriber LTV is cumulative revenue per subscriber, per Loop's docs. Take your margin off before you set CAC with either.
Customer lifetime value in Shopify
No subscription app report at all? Shopify has a free one. Go to Analytics, Reports, Customer cohort analysis. Month 0 is the first purchase month and the columns are the months after. Switch the metric to amount spent per customer and you can read spend by cohort. Shopify can also show projections of future spend per cohort, and its own help page says those are not guaranteed.
It counts all customers and all orders, by month. So it is useful for one-time repeat behaviour, and it is revenue. It cannot give you order 3 for subscribers.
If you have never read a cohort chart, start with subscription cohort analysis.
Subscribers vs non-subscribers over 12 months
This is the slide founders want. At the same gross margin, a subscriber is worth roughly 3 to 5x a one-time buyer.
The mechanism is purchase frequency. Subscribers average about 4.4 orders a year. One-time buyers average 1 to 1.5 in a lifetime. Recharge's 2026 Trend Report, built on 20,000 brands, says subscribers placed nearly 3x more orders than one-time shoppers.
| Category | Subscriber vs one-time buyer |
|---|---|
| Pet | 4 to 5x |
| Beauty | 3 to 5x |
| Supplements | 3 to 4x |
| Food and beverage | 3 to 4x |
Those ranges come from CFO and agency publishers, not audits. Use the direction. Recharge's own figure inside one brand is lower, 1.8 to 2.5x.
The Recharge lifetime revenue dashboard
If you are on Recharge, you do not need to build this split yourself. Go to Analytics, then Dashboards, then Lifetime revenue. It shows subscriber vs non-subscriber 12-month value and orders side by side. We screenshot it in every audit, because it is the one slide a founder believes straight away.
One caution. It is revenue. Take your margin off first.
Customer LTV: mixing the two by take rate
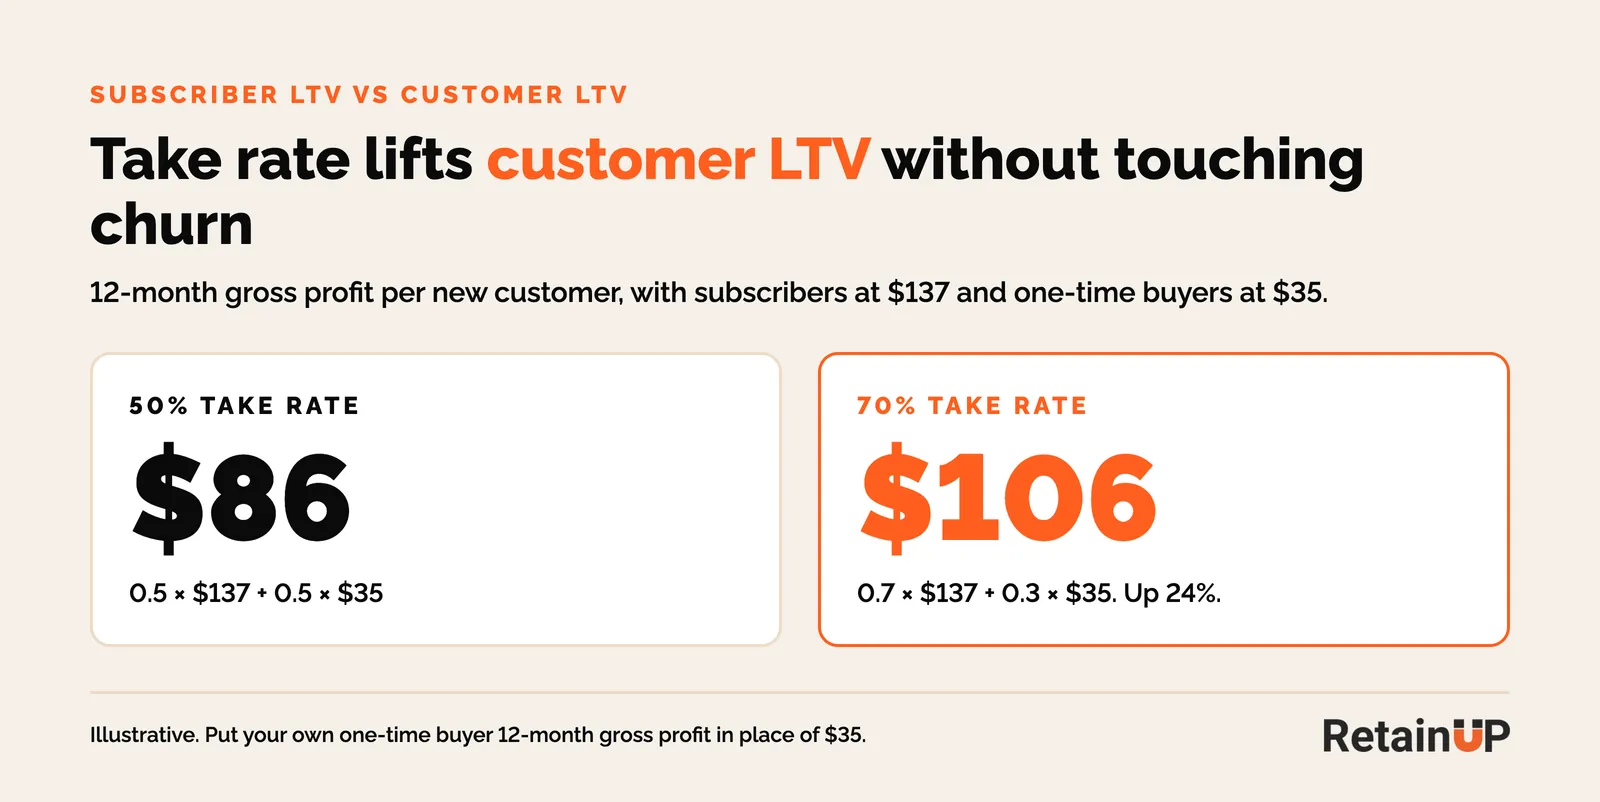
For a DTC brand there is a second number on top: customer LTV, which mixes subscribers and one-time buyers by your take rate. With subscribers at $137 and one-time buyers at $35, moving take rate from 50% to 70% lifts 12-month customer LTV from $86 to $106. Up 24% with no change in churn. How to count take rate is in the subscription take rate formula.
Why the simple formula misleads
Go back to the 400 March subscribers. The simple formula, using the 8% churn rate the app dashboard shows, says $338. The cohort paid $137 in 12 months. Same people. Same $27.
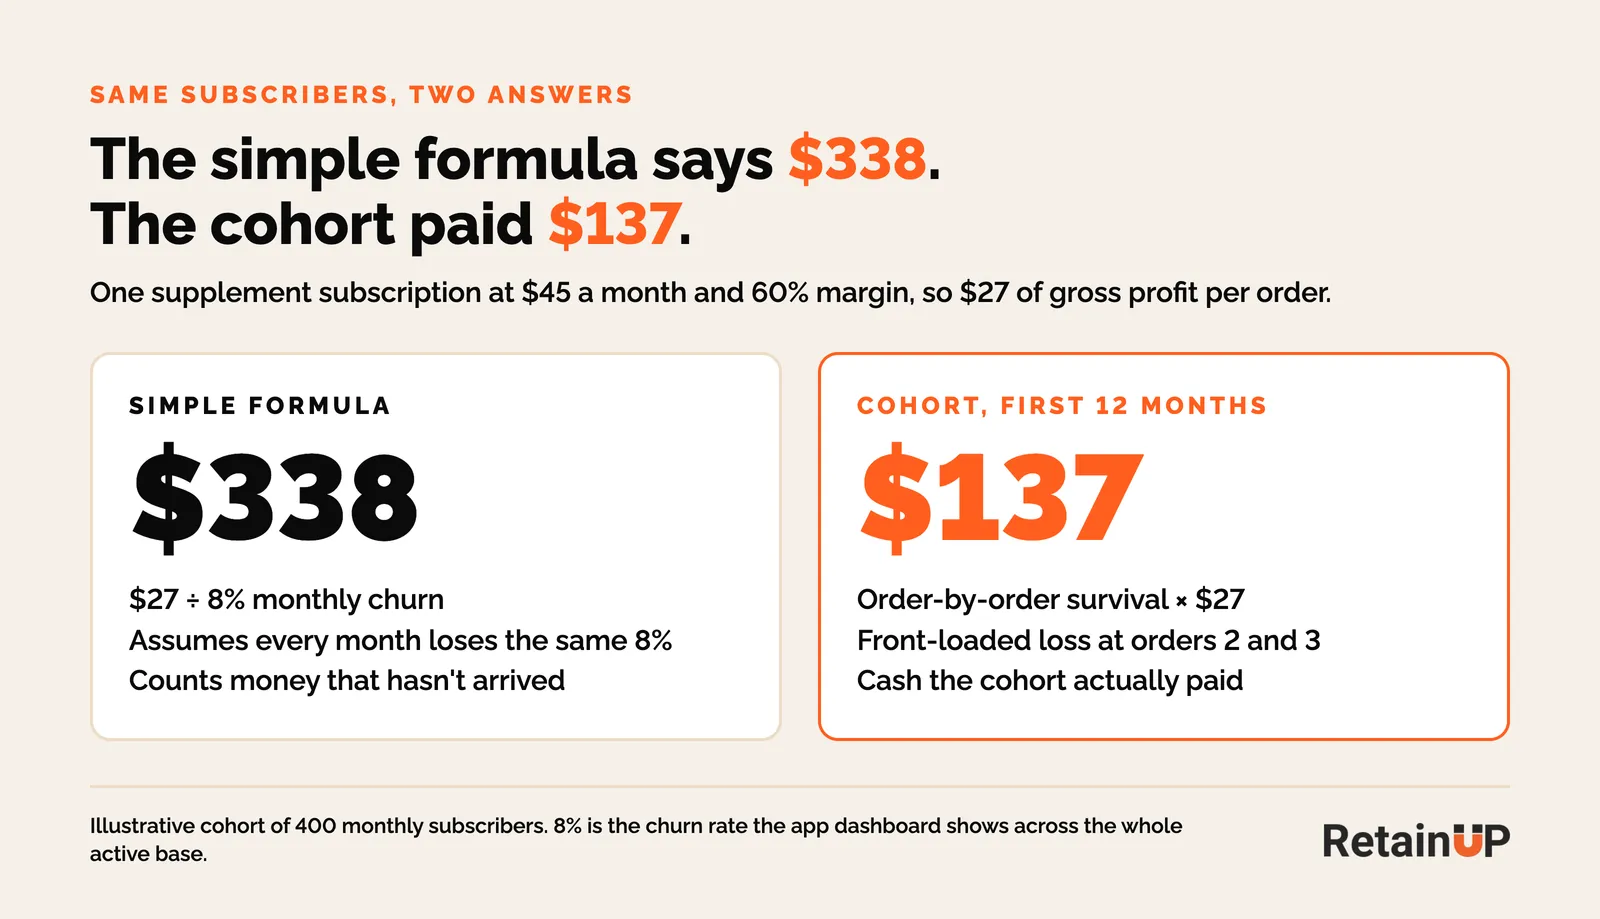
It assumes every month loses the same share
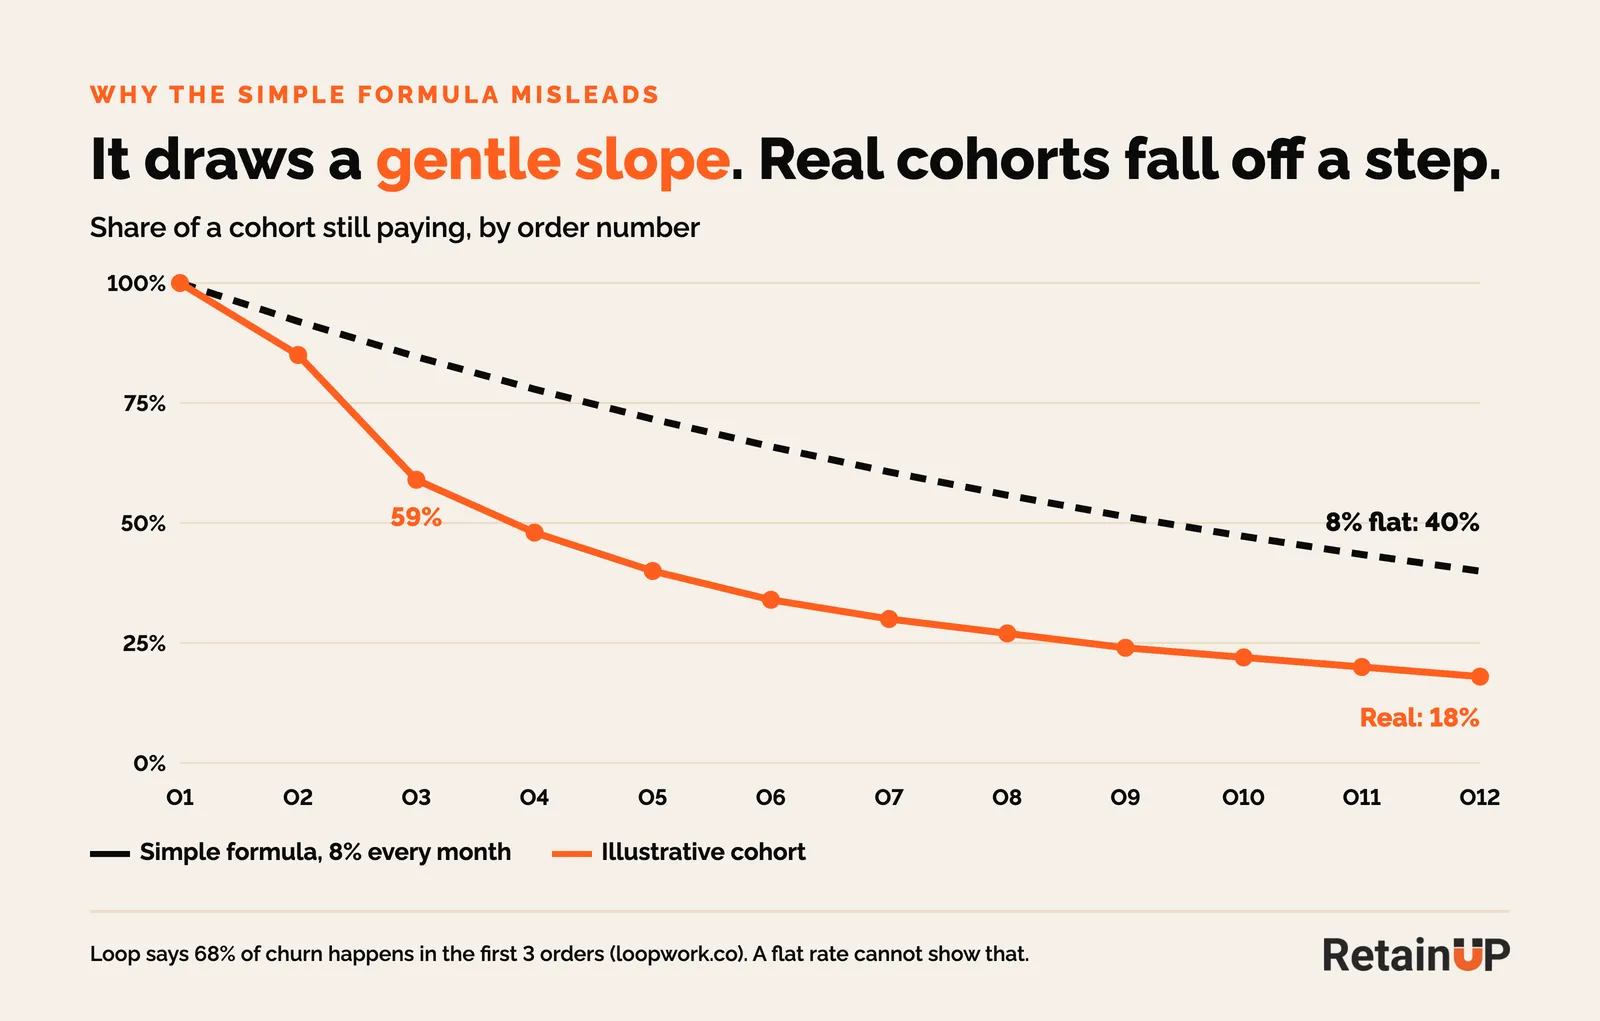
Real cohorts lose most people at orders 2 and 3, then flatten. Loop says 68% of all churn happens in the first 3 orders. Month-1 churn is typically 25 to 35%, and the curve does not flatten until month 3 to 6.
The dashboard churn rate is mostly survivors
Your app divides cancellations by every active subscriber. Most of the active base are people who already made it past order 3 and churn slowly. So the rate looks calm while each new cohort loses 41% before its third order.
It mixes billing frequencies
A monthly subscriber faces 12 renewal decisions a year. A quarterly one faces 4. Put them in one churn rate and the number partly measures your plan mix. Annual billing removes 11 of 12 cancellation decisions, which is why prepaid plans get their own cohort.
It counts money that has not arrived
Cap the simple formula at 12 months and it still says $213, because it carries 40% of the cohort to order 12 instead of 18%. Run the real curve forever, with the survivors leaving at 8% an order, and you get about $193. And you wait years for it.
Why lifetime LTV misleads a young brand
Lifetime LTV almost always overstates real value. Treat it as a ceiling, never a planning input.
Take a subscriber at $27 a month and 5% churn. On lifetime LTV they are worth $540, so a 3:1 ratio lets you pay $180 to acquire them. Count only what they pay in the first 12 months and it is $248. That is 1.4:1.
A young brand gets hit harder. It has no mature cohorts, so it ends up using 36-month projections on 18 to 24 months of history.
LTV doesn't pay your bills. Cash does. You spend $80 to acquire a customer, collect $40 on the first order, and need purchase 2 to break even. That happens 90 days later. On paper you are printing money. LTV pays eventually. Payback pays this month.
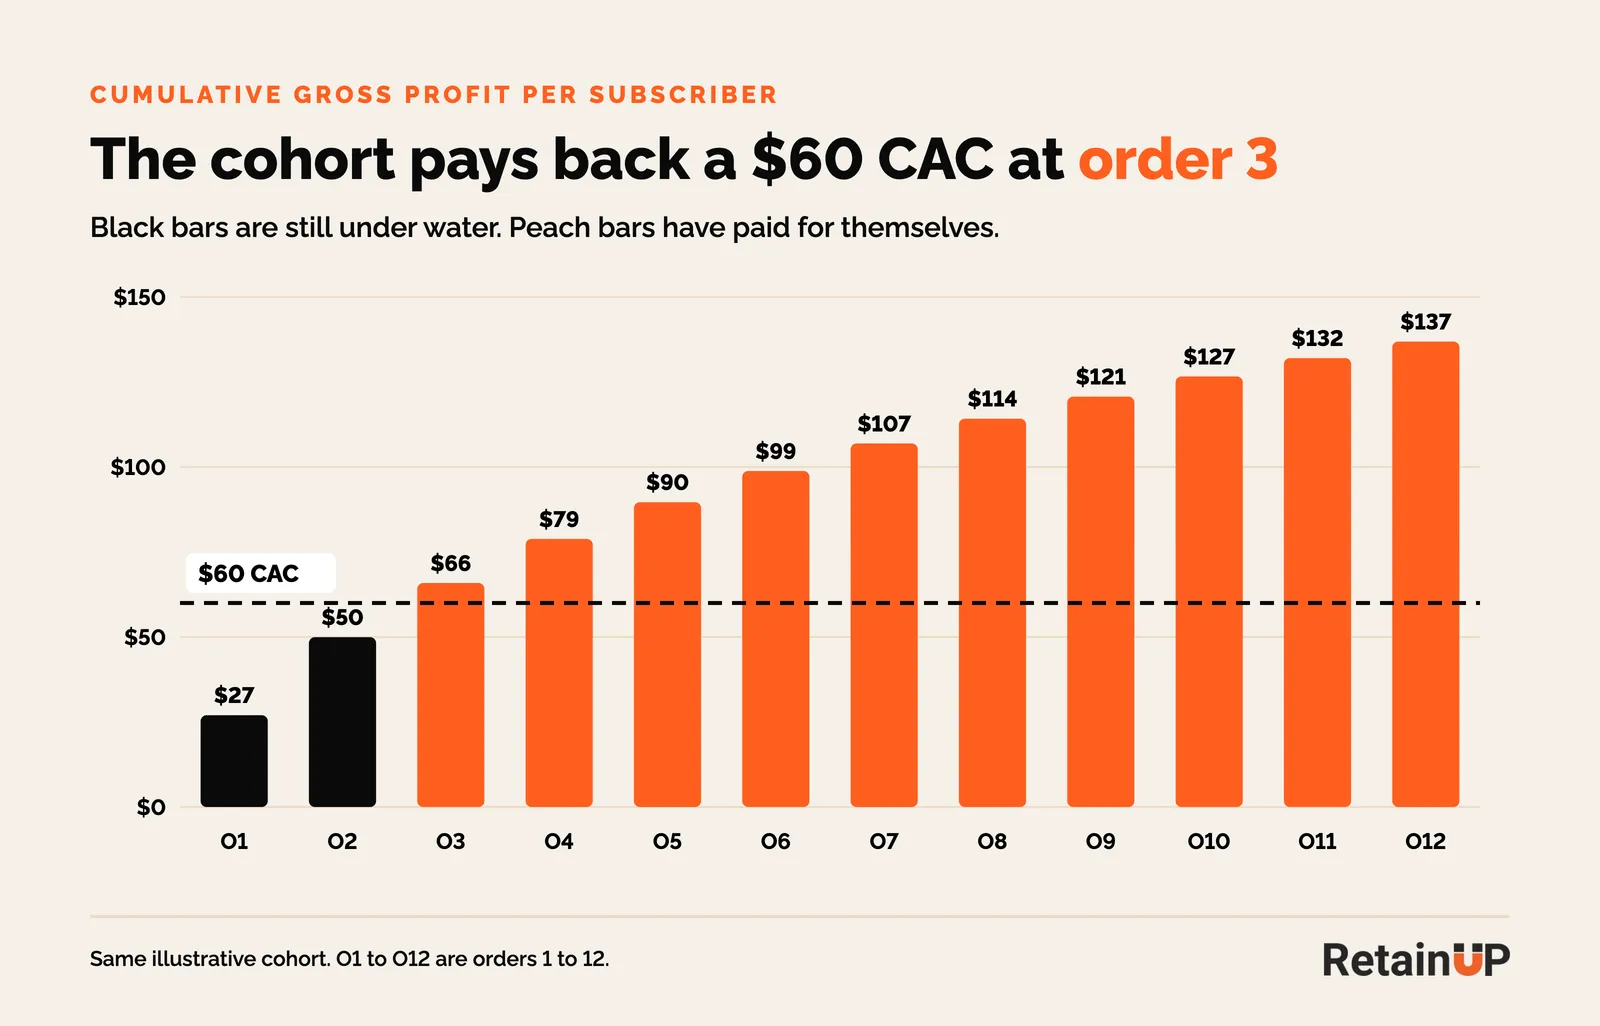
In the March cohort, a $60 CAC comes back at order 3, around day 60. Every subscriber lost before order 3 cost you money. The rest of that story is in CAC payback.
Predicted LTV inherits all of this
Predicted LTV from Klaviyo, Lifetimely or Yotpo counts future orders on top. Eightx puts the overstatement at 20 to 40% against actual cohort LTV. I once saw one brand's LTV come out three ways from the same data: $103.88, $44.41 and $100.12.
What Klaviyo customer lifetime value shows
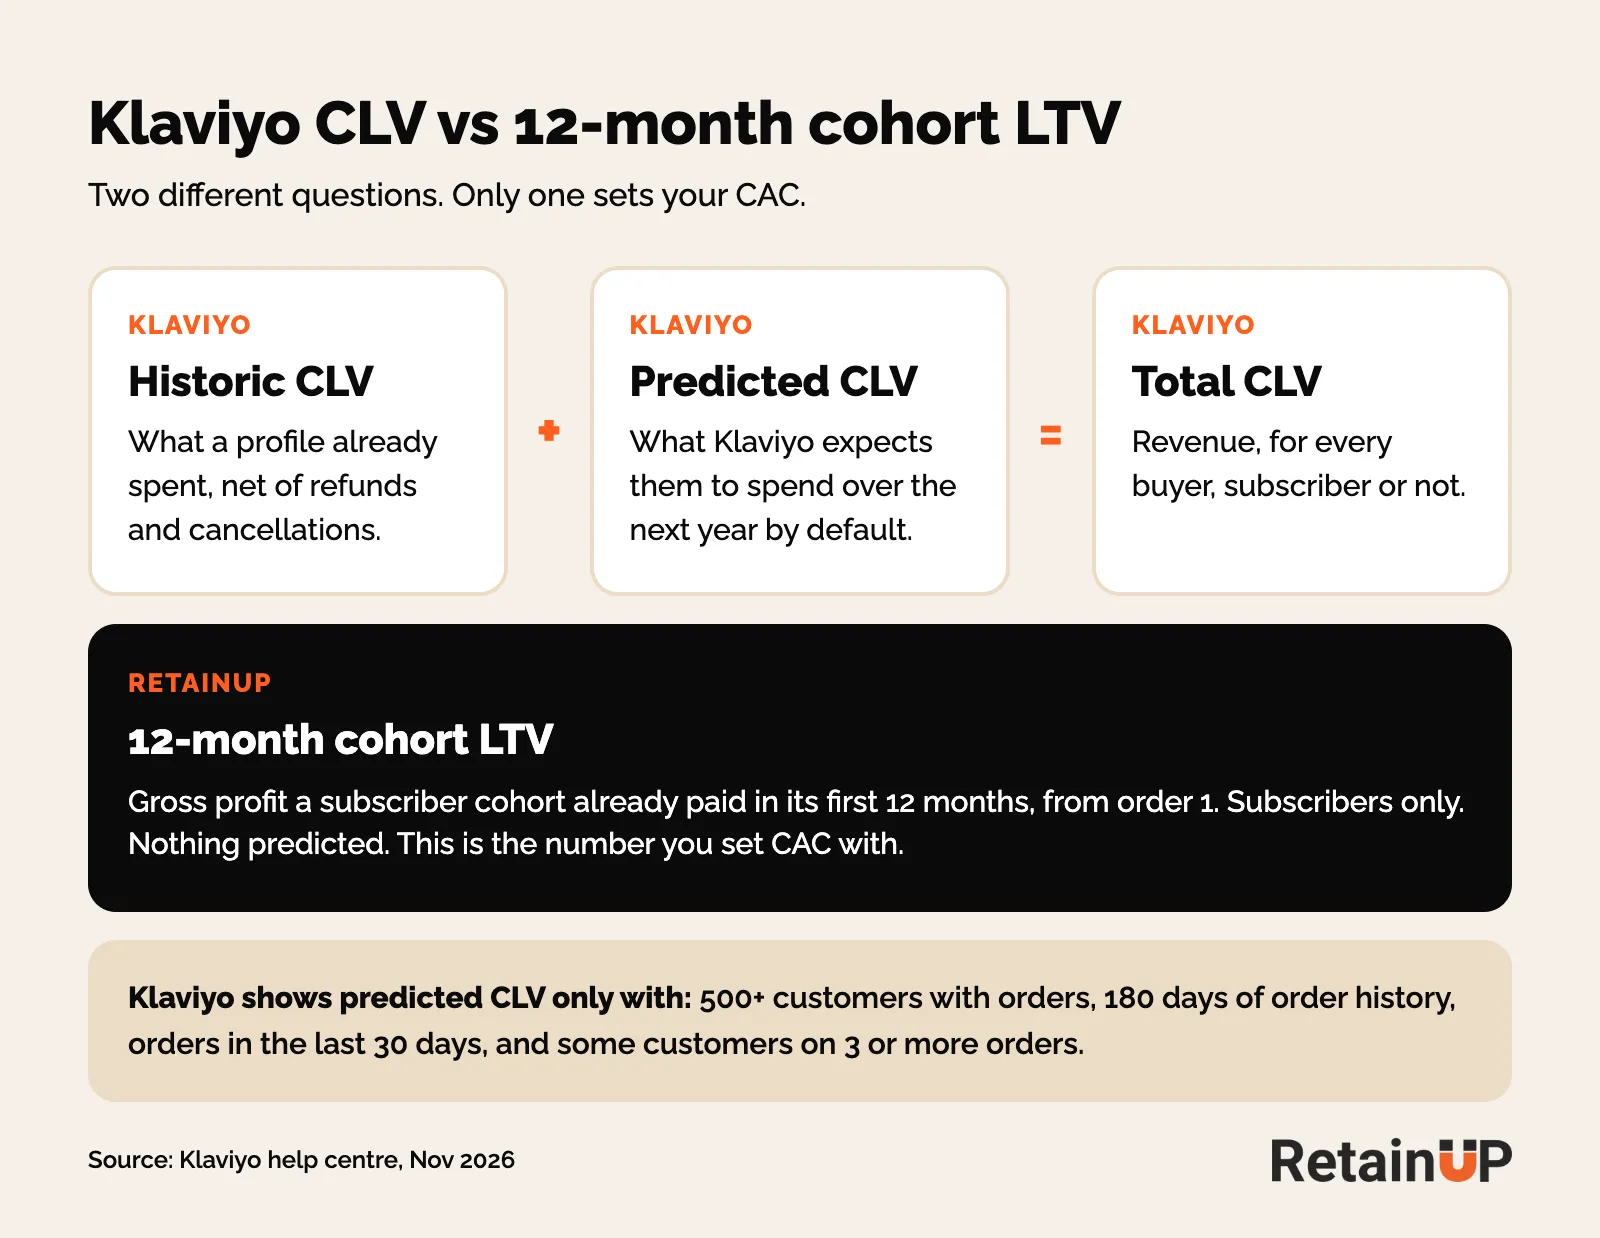
Klaviyo splits CLV in two. Historic CLV is what a profile has already spent, net of refunds and cancellations. Predicted CLV is what Klaviyo expects them to spend over the next year by default. Total CLV adds the two.
It only appears once you have at least 500 customers with orders, 180 days of order history, orders in the last 30 days and some customers on 3 or more orders, per Klaviyo's help centre. And it is revenue, for every buyer, subscriber or not. So read historic CLV on a subscriber segment as a cross-check. The cohort sum stays the number you set CAC with.
Five calculation mistakes I see in audits
- Blending subscribers and non-subscribers into one LTV. Model them as separate cohorts.
- Counting $0 first orders as order 1. Start from the first paid order, or your order 2 is really order 1.
- Comparing dollar figures across brands. A $45 product will never match a $90 one.
On that last one: the curve bands and the category dollar ranges live on subscription benchmarks. Our example brand earns $137 in 12 months, well under the $500 to $1,000 Eightx gives for supplements, while its 59% order 3 retention sits in our average band.
And split it once you have it. Run the same sum by first product, and by whether order 1 came in on a big discount. On one of our brands, subscribers who started on the adult range were worth about 66% more than those who started on the kids range, and the gap held on cohorts of the same age. For a cut by customer, RFM analysis does that job.
If you want these numbers read from your own cohorts, the Subscription LTV Roadmap™ is a full read of your Recharge, Loop, Skio or Stay AI data, then a 90-day plan of 30 to 50 changes in order, in 3 working days, for $1,000. For a quicker first look, the free subscription audit runs 48 checkpoints and names your top 3 leaks in 24 hours.
FAQ
How do I calculate subscription LTV in Recharge, Skio or Loop?
Pull retention by order number for one monthly cohort, then multiply each order's share by gross profit per order, and add orders 1 to 12. In Skio use the Cohort Dashboard set to Subscribers. In Loop use the Order-Level cohort view by frequency. In Recharge use Subscription Retention by Order Number, and check it counts from order 1.
Should subscription LTV use revenue or gross profit?
Gross profit. Take off the first-order discount, product cost, shipping, packaging and payment fees before you multiply. At 50% margin, revenue LTV is double what you can actually spend on acquisition, so a CAC set on revenue LTV loses money on every new subscriber even when the dashboard says the ratio is fine.
Why is my predicted LTV higher than my cohort LTV?
Predicted LTV adds orders that haven't happened and usually assumes churn stays flat after the first months. Eightx puts the gap at 20 to 40% for tools like Klaviyo, Lifetimely and Yotpo. Trust the cohort, and check the prediction against it every quarter until the two agree within about 10%.
How long before I can trust my 12-month LTV?
A monthly cohort needs about 13 months to show a full 12-month LTV: twelve orders plus around 30 days for skips and payment retries to settle. Before that, read order 3 retention, which you can see in month 3 and which predicts most of the curve, since most churn happens in the first three orders.
One email a week on subscription retention: the numbers, the strategy, and what to fix first.

Rahi Jain
Rahi Jain is a subscription LTV specialist who helps $1M to $10M DTC brands reduce subscription churn and maximize LTV on Recharge, Skio, Stay AI and Loop.
More about Rahi