Key takeaways
- Recharge data on about 1,750 supplement brands shows 49.1% of subscribers still active at order 3. YOCTO's median store keeps 52%.
- Across 8 subscription brands RetainUP audited in 2026, the median cancel flow saved 10.8% and the median brand recovered 38% of failed payments.
- Wellness churns 8.8% a month in Recharge's 2026 Trend Report, the highest of any subscription category, and still rising.
This is one part of the subscription metrics guide, which walks every number in order.
Ask two subscription apps what good retention looks like for a supplement brand.
Skio says 70 to 80% of supplement subscribers churn before order 3. So 20 to 30% are left. Recharge looked at about 1,750 supplement brands, and 49.1% were still there at order 3.
Same category. Same order. The answers are twice apart.
Loop adds a third number: 68% of all churn happens in the first three orders.
So this page keeps every benchmark we use in one place, each with its source, its date and the catch.
Read the definition before the number
Every source below sells retention software or services. Us included. Use them as ranges, not targets.
And every tool calls a different number "retention". Shopify shows a returning customer rate. Your subscription app shows 90-day retention or monthly churn.
Even two tools that say "order 3" count it differently. Some count subscriptions, some count subscribers. One customer with two products is two subscriptions. Some count a paused subscriber as retained. Some count a failed payment still in retry as active.
And most count by month. At month three, a monthly subscriber has paid three times and a quarterly one once.
So a number without its definition is just a number. Before you compare yours to anything on this page, check you counted it the same way.
Take rate benchmarks by category
Take rate is the share of buyers who choose the subscription. How to count it, at order level and customer level, is in the take rate formula. Here is what the published numbers say.
Recharge's 2026 Trend Report, built on 2025 data from about 20,000 brands, gives the share of checkouts with a subscription by category:
| Category | Checkouts with a subscription | Avg orders per subscriber |
|---|---|---|
| Home | 32% | 3.06 |
| Health & Wellness | 28% | 4.41 |
| Pet | 21% | 4.43 |
| Food & Beverage | 16% | 4.61 |
| Beauty & Personal Care | 11% | 4.52 |
Beauty has the weakest funnel, 11% and down 8% year on year, yet the subscribers it does win stay engaged. That reads like a product page problem. The subscription just isn't being shown well at the moment of choice.
Inside the Recharge admin there is a Benchmarks page (Home, Benchmarks) by vertical. For Beauty & Personal Care, Nov 2025 to Oct 2026, the median share of checkout orders with a subscription was 8.3%. Every Recharge store sees its own percentile there.
YOCTO counts it per customer. At its median store, 25% of new customers start with a subscription, and the middle half of stores sit between 11% and 71%.
Then the upper end. IM8 converts 79% of new customers to subscription on the first order. Most health brands treat 40 to 50% as a win. Below 40% you are running a store with a checkbox.
One caution. Take rate bought with a deeper discount is a different number from take rate earned with a clearer offer, so check how a brand got there before you copy it.
Subscription retention rate benchmarks: Order 3
Subscription retention rate is the share of subscribers still paying after a set number of orders. We use Order 3: subscribers who paid order 3 divided by subscribers who paid order 1, same cohort. Why we picked that one is in Order 3 retention. In a hurry? Watch the breakdown.

Recharge
Recharge's benchmark covers about 1,750 supplement brands, updated October 2026, counted by order. 49.1% of subscribers make it to order 3. Read the report
YOCTO
YOCTO's benchmark covers stores it runs or has audited, subscribers who started May to October 2025. Its median store keeps 52% to order 3. The weakest keep 27%, the best 73%, and the middle half sit between 44% and 56%. Read the report
That's within 3 points of Recharge, from different stores counted a different way.
Our audit data
Across 9 subscription brands we audited in 2026, before we changed anything, a median 45.6% of new subscribers reached order 3. The range ran from 30.1% to 61.2%. And a median 73.6% reached order 2, so the gap opens after the second order.
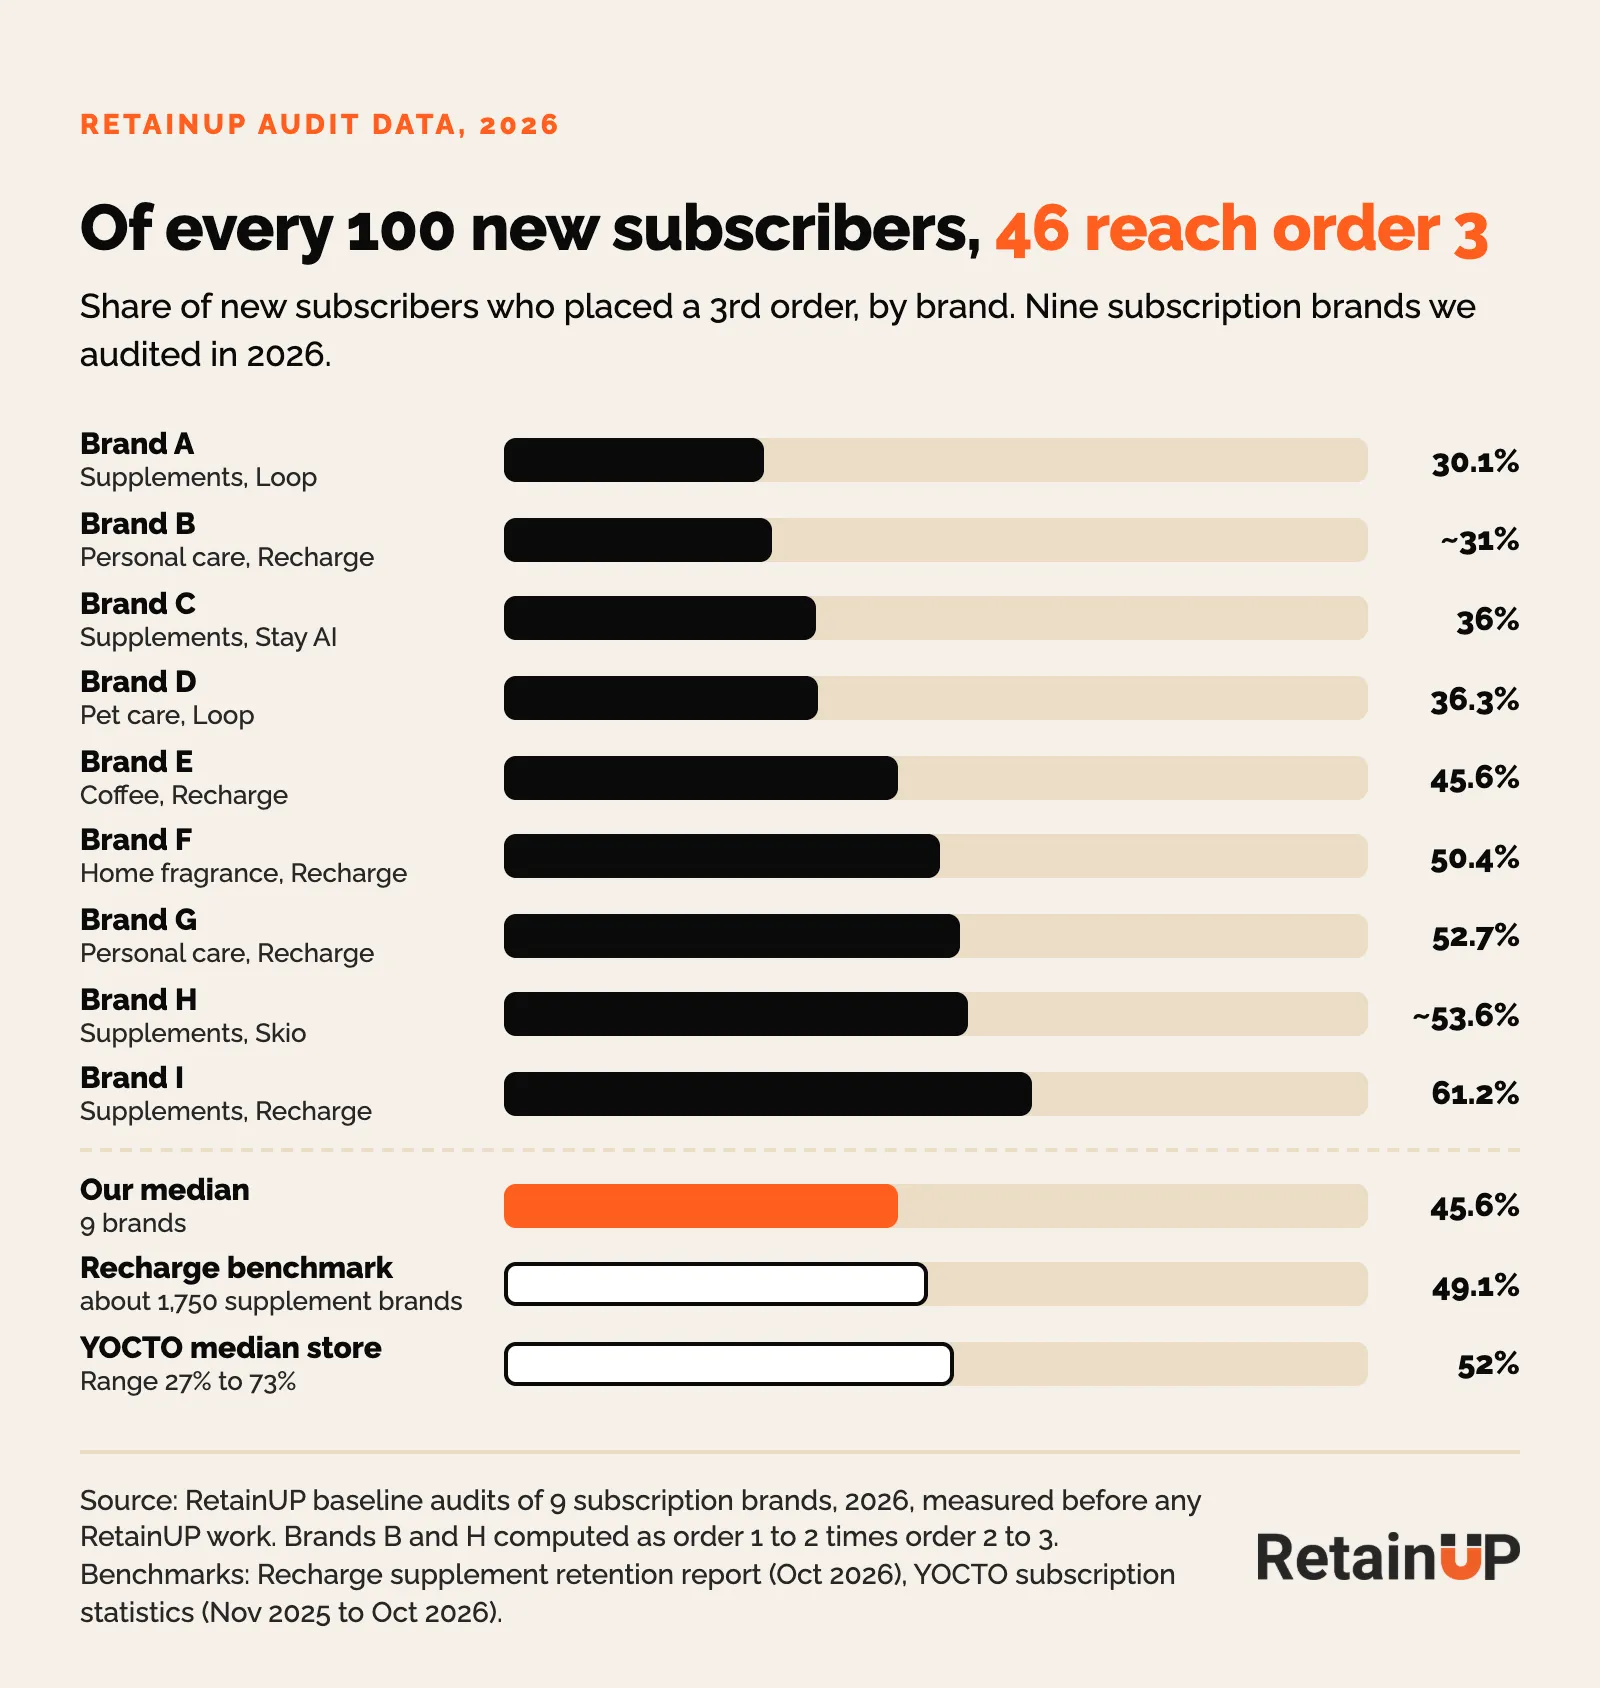
Nine brands is a small sample, and brands that hire a retention consultant often have a problem, so it may run low. Where those subscribers drop and what fixes each drop is in getting past order 2 and order 3.
RetainUP bands
Our bands for supplements on a monthly plan, pay as you go, paid first order. Built from both reports and client cohorts. They are our synthesis, not an industry standard.
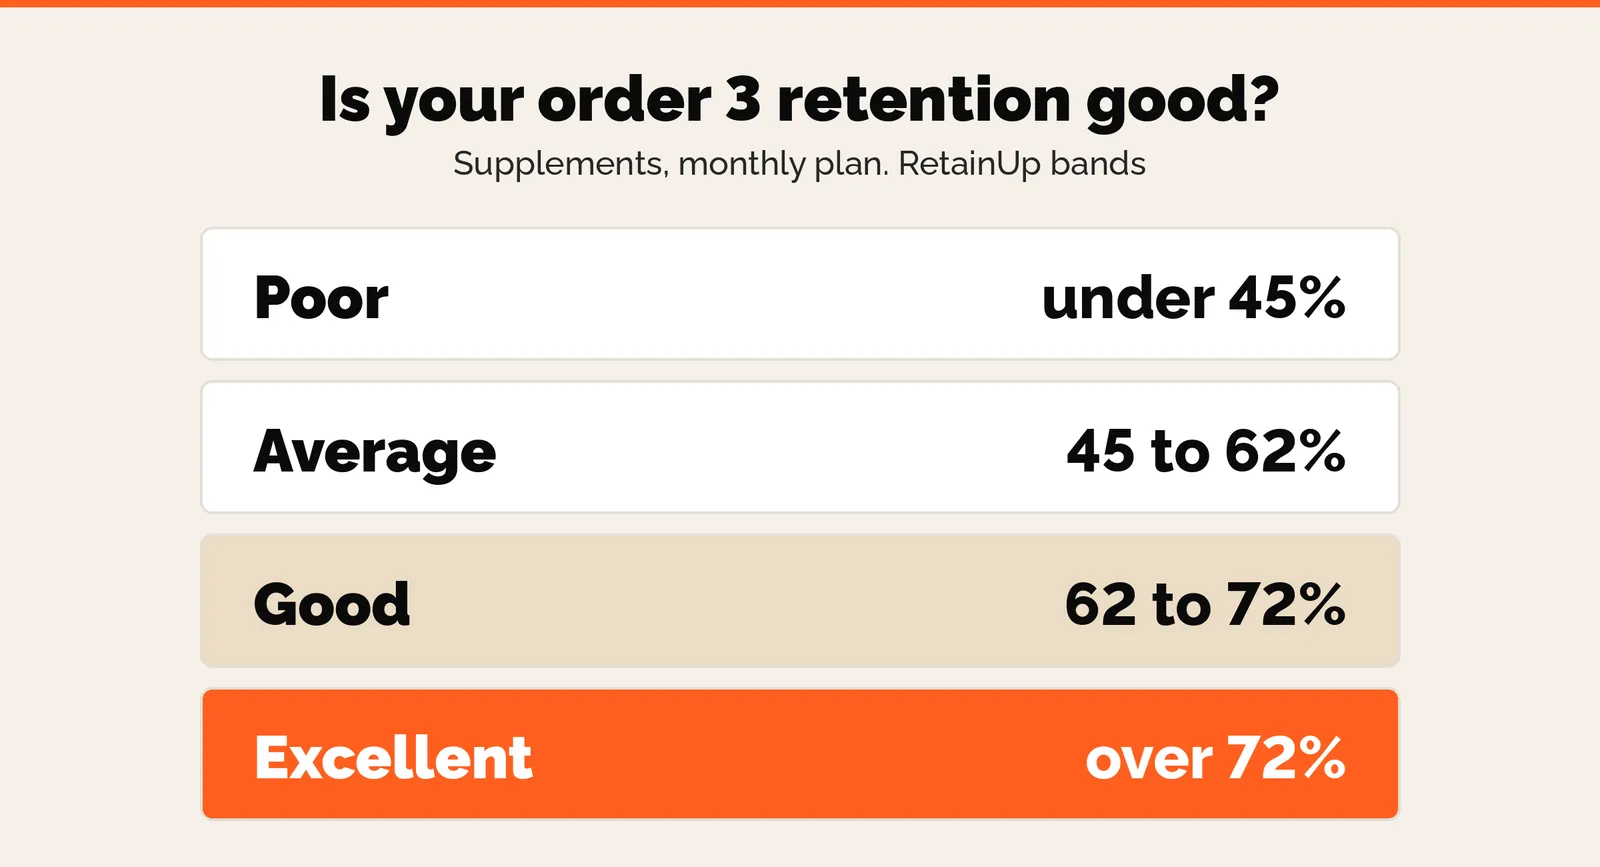
| Rating | Order 3 retention | Order 2 retention |
|---|---|---|
| Poor | under 45% | under 80% |
| Average | 45 to 62% | 80 to 90% |
| Good | 62 to 72% | 90 to 95% |
| Excellent | over 72% | over 95% |
Retention curves past order 3
Recharge's supplement curve keeps falling after order 3. 34.4% reach order 4. By order 7 it's 15.5%, and by order 13 it's 5.7%. The weakest step is the one into order 3: only about 65% of subscribers who paid order 2 pay order 3.
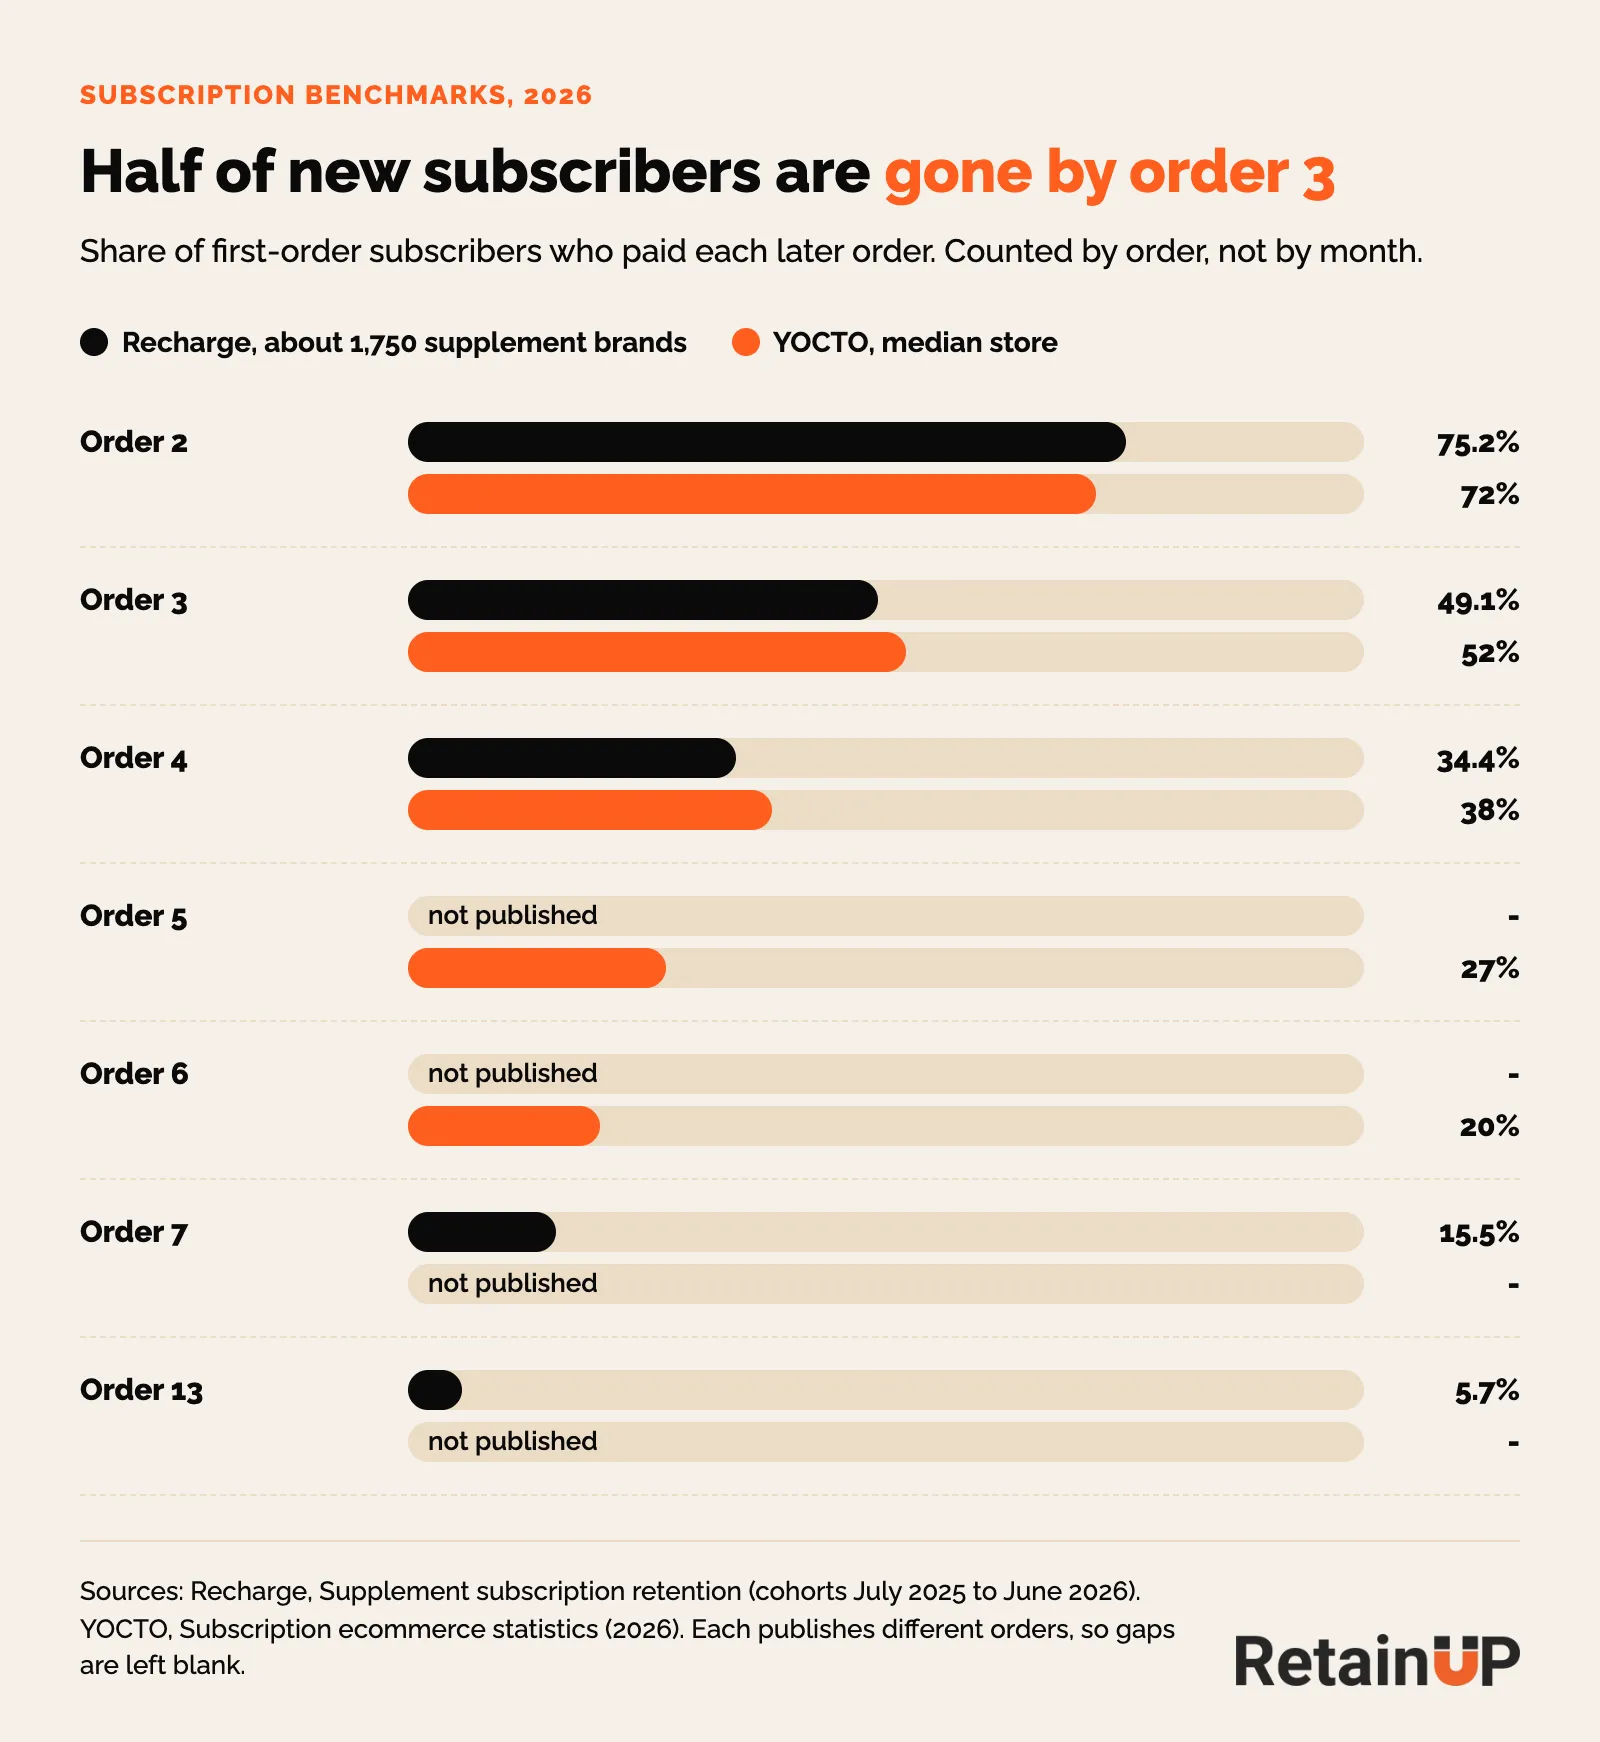
YOCTO's median store runs close. 72% at order 2, 38% at order 4, and 20% by order 6, about one subscriber in five.
Recharge also counted when people cancel. In its renewal data from July 2025 to March 2026, about 61% of voluntary cancels came at the first two renewals. About 72% came within the first four. Churn peaks at about 27% on the third order, then falls to about 5% by the twelfth. Failed payments are left out.
| Category | Churn at the first renewals (orders 2 and 3) | Churn once mature (order 6 on) |
|---|---|---|
| Food & Beverage | 28.2% | 6.4% |
| Pet | 27.8% | 6.5% |
| Health & Wellness | 26.5% | 7.5% |
| Beauty & Personal Care | 26.3% | 8.5% |
| Home | 23.4% | 12.3% |
So every category loses about a quarter at the first renewals. The categories split later, once the habit sets in.
At the first reorder, supplements now do best of the six categories Recharge compared: 75.2%, against 73.3% for coffee and tea, 71.7% for pet supplies, 71.0% for beauty, 69.4% for health and wellness and 63.1% for food.
Darkroom quotes Recharge data on 15,000+ merchants by month. 45% of subscribers are still active at six months. 33% at twelve. Churned's Subscription Retention Benchmark Report 2026 also counts by month. New-subscriber retention runs 86% at month 1, 60% at month 3, 46% at month 6 and 34% at month 12. Different base, so don't lay it over an order curve.
And a floor, from Thomas Lalas. Product quality alone, with no retention system, gets a brand about 45 to 55% 30-day repurchase and 12% retention at 12 months.
Monthly churn benchmarks
Recharge's 2026 Trend Report has the headline: subscribers placed nearly 3x more orders than one-time shoppers, and 59% of order volume came from subscribers. The average subscriber is worth $319 in lifetime revenue.
But wellness churns the fastest of any category. 8.8% a month, and rising. At that rate a brand loses about 65% of its subscribers within 12 months.
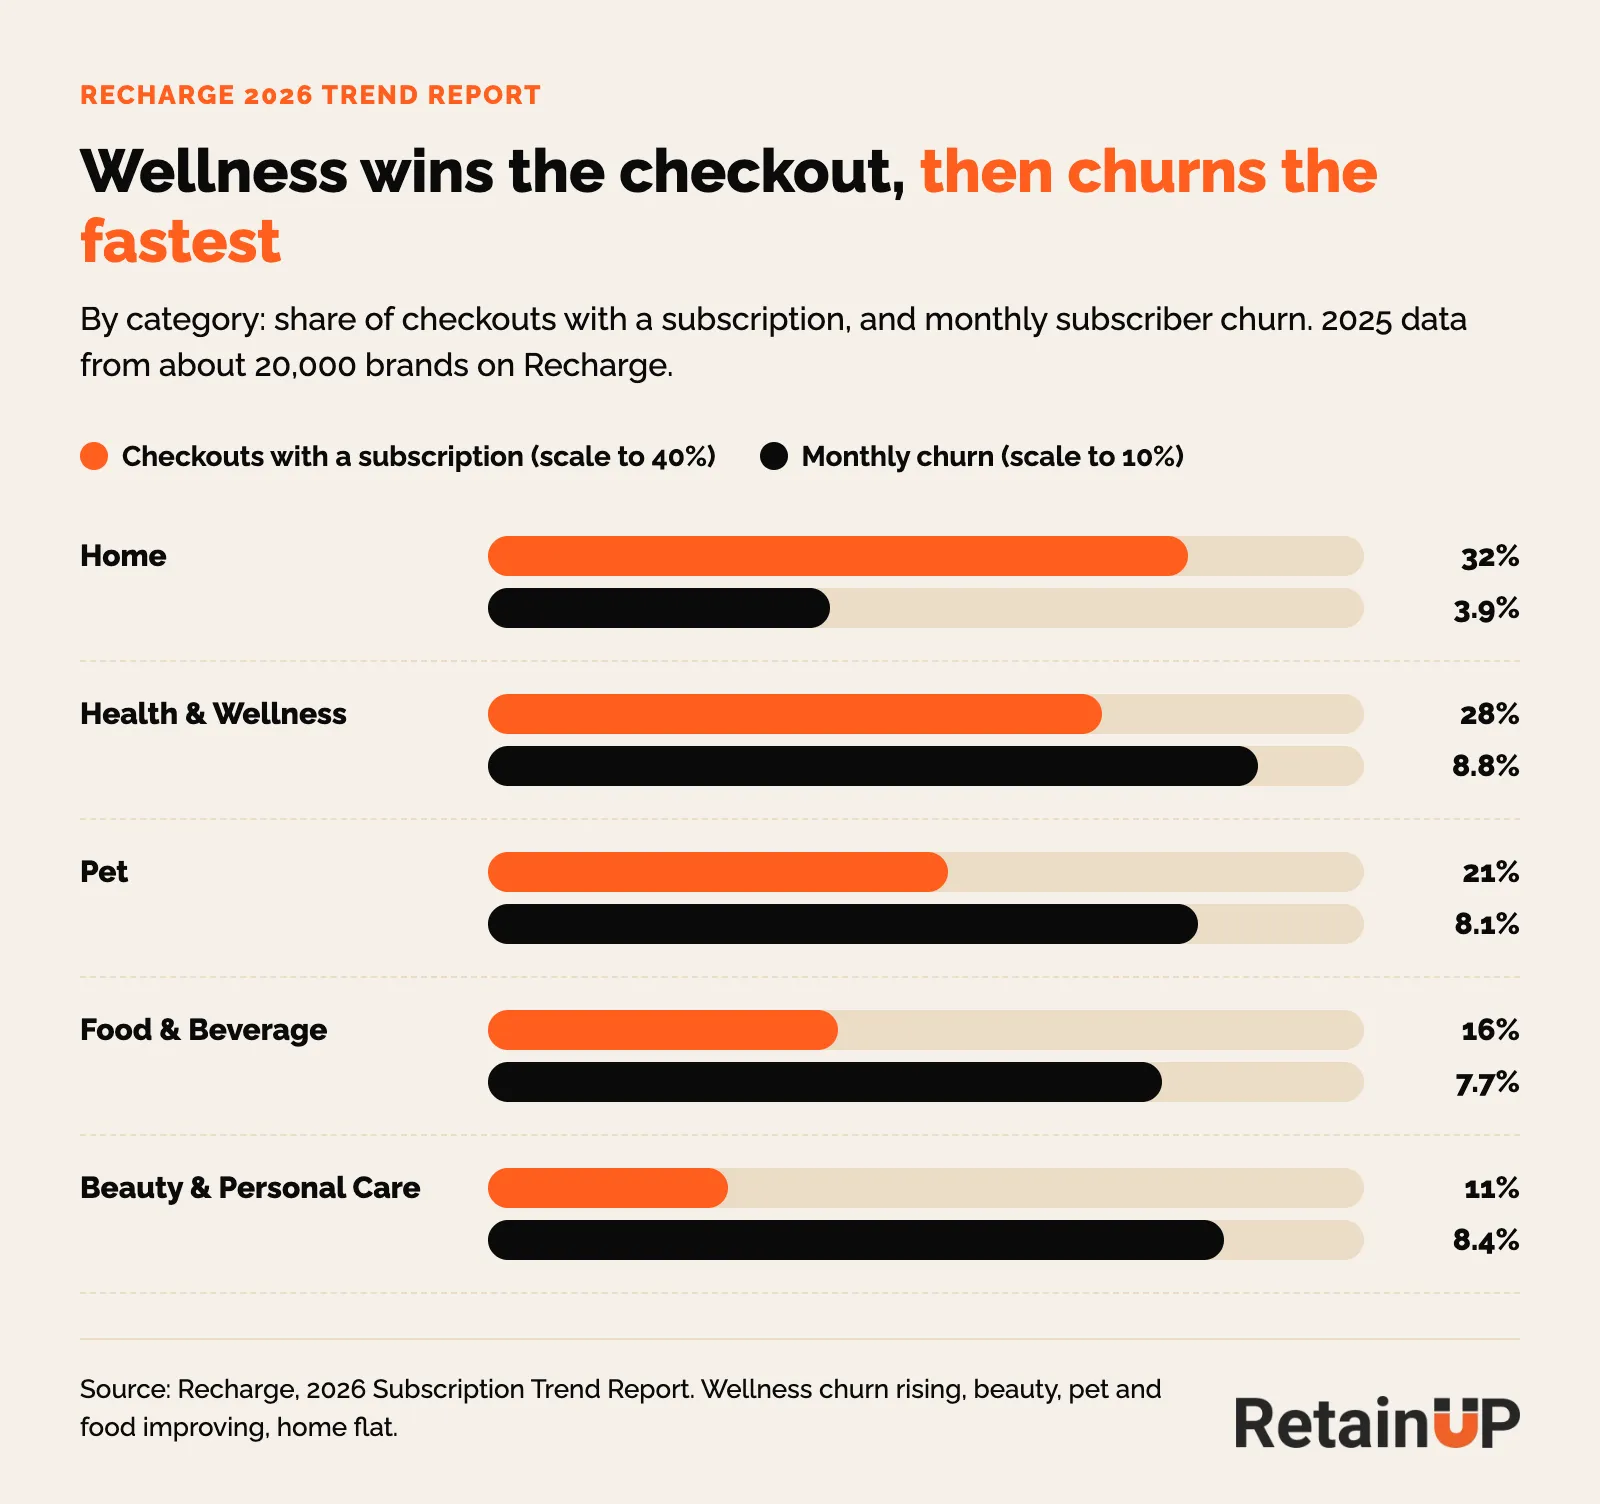
Recharge's own read: brands are exceptional at converting intent and bad at holding the subscriber long enough for intent to become habit.
That's the whole problem in one line. Everyone got good at winning the subscribe click. Almost nobody got good at the 90 days after.
Outside Recharge, Eightx puts the cross-category average at 5.3% a month, citing Recurly. Replenishment runs 5 to 8%. Curation boxes run 10 to 15%. Its spread comes from Subbly: the top quarter of stores churn under 3% a month, the bottom quarter over 13%. Small gaps compound. 5% a month loses about 46% of subscribers in a year. 8% loses about 63%.
Churn is also seasonal. Churned puts the peak in December and January, at about 4.1 to 4.3% a month, and the low in November at 3.2%, with August and September close behind. So compare a December number to last December, not to October.
Plan length moves it too. Eightx puts average monthly churn at 8.3% on monthly plans and 2.1% on annual plans.
Cancel flow save rate benchmarks
Save rate is the people who took a deal to stay, divided by everyone who started the cancel flow. Some apps count anyone who left the flow without cancelling as saved, which is how a Stay AI or Loop dashboard can show 65 to 80%. One Stay AI brand showed 62.5% in the app. With abandons removed, it was 12.5%.
Across 8 subscription brands we audited in 2026, counted as saves only, the median cancel flow saved 10.8%. The range ran from 3.3% to 19.3%. About 1 in 9.
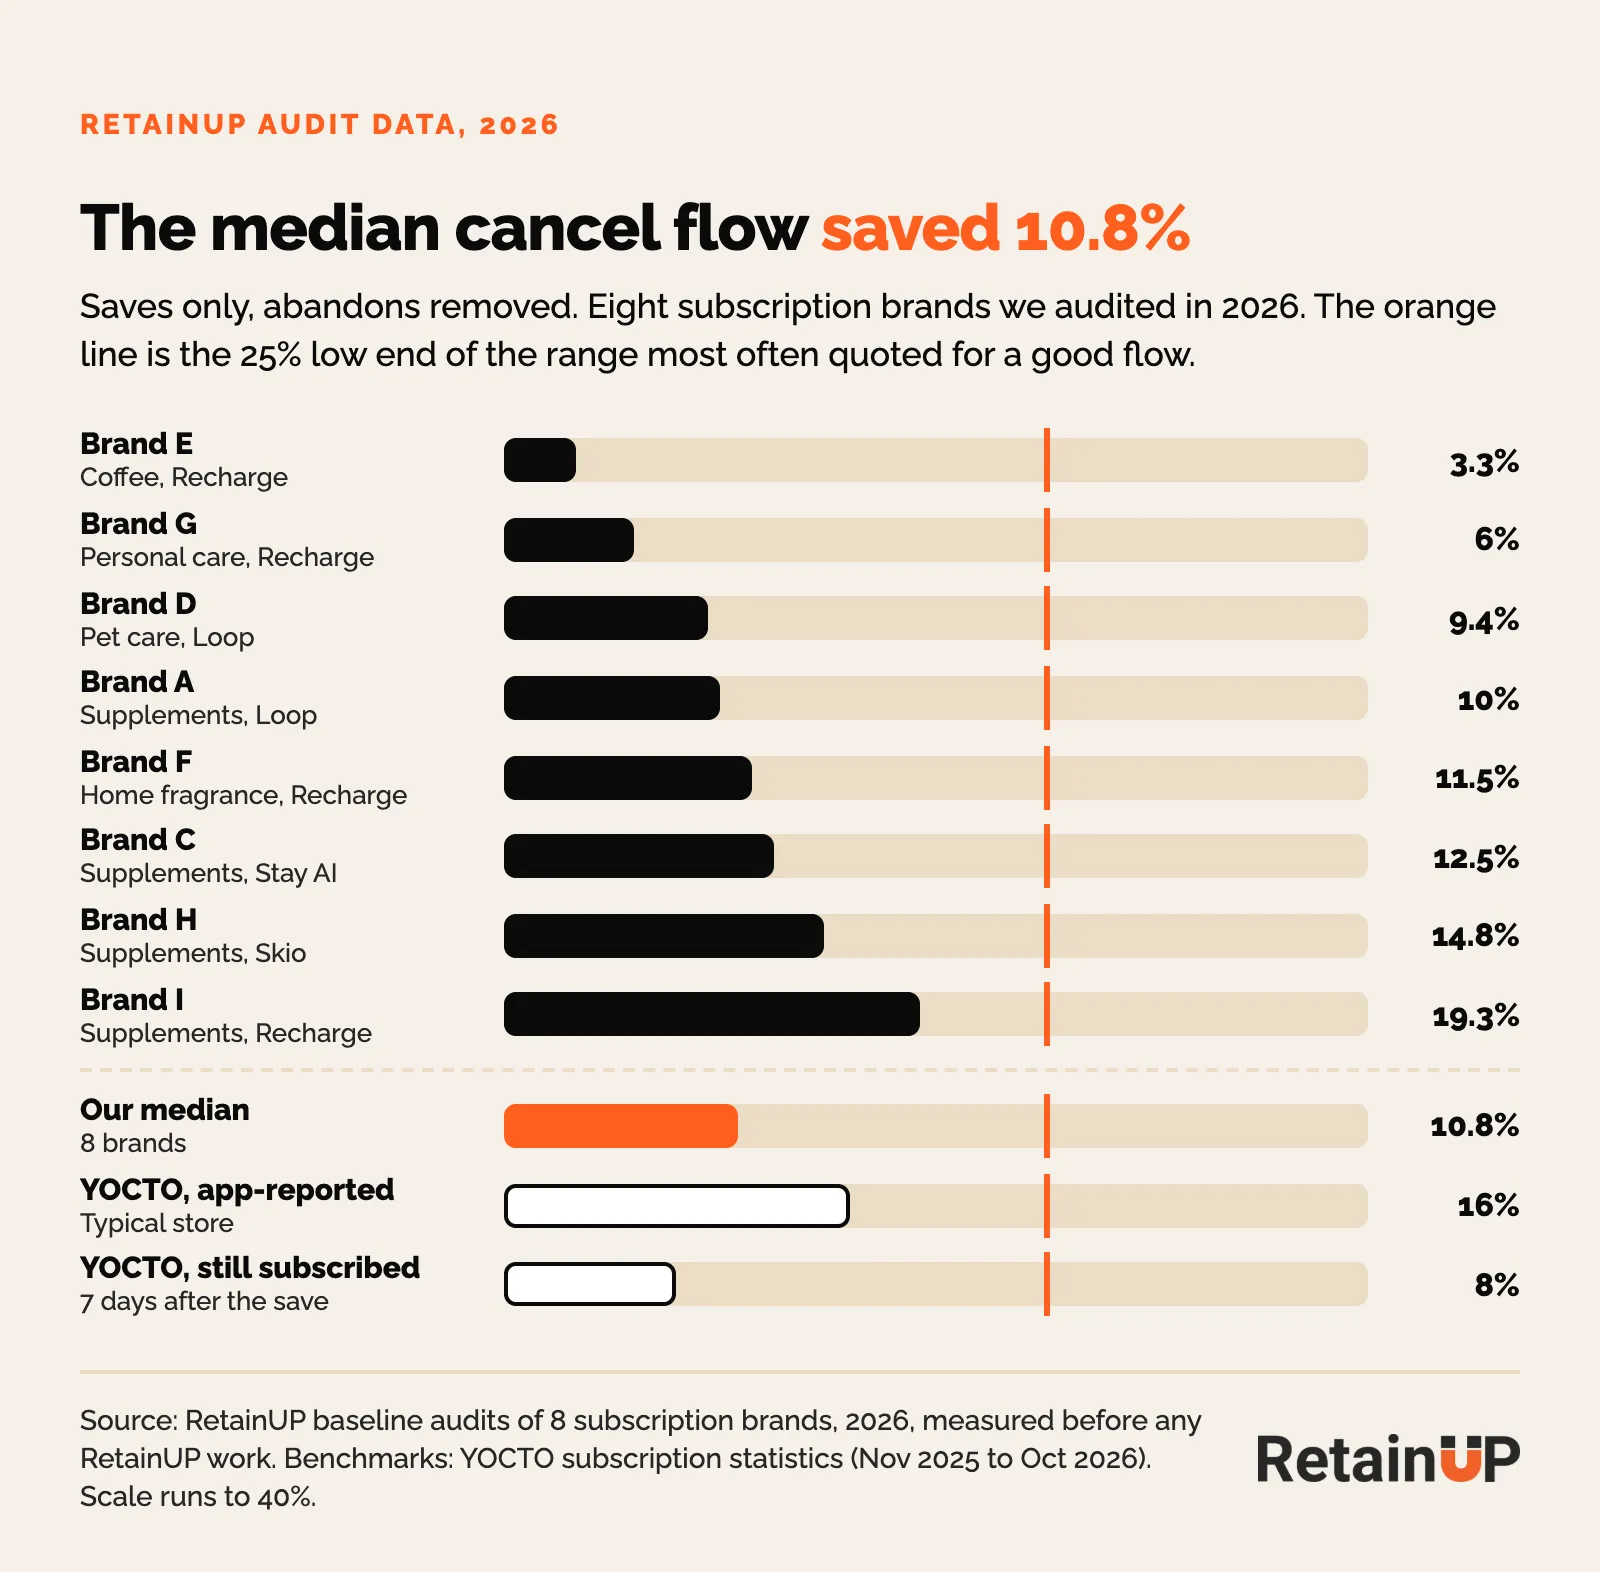
YOCTO publishes two numbers: 16% as the apps report it, and 8% when you count only people still subscribed a week later. Ours sits between them.
Loop's data on 441K cancel attempts across 87 brands gives the spread. A generic discount saves about 6%, and a three-stage flow about 15%. The best brands pass 20%.
Published brand cases run higher. Four Sigmatic 22%. TruHeight 20.5%. OLIPOP 24 to 25%, pairing a 30% cancel discount with a flavor swap and education. These are vendor case studies, picked because they worked.
And a save only counts if they pay again, so Recharge tracked supplement subscribers after the cancel screen. Those who cancelled ordered again less than 2% of the time. Those who took an offer ordered again 66% of the time after a swap, 53% after a delay, 49% after a discount and 44% after a skip. YOCTO found 26% of monthly-plan saves still there two months later.
Then there's 25 to 33%, quoted everywhere as best in class. We have quoted it too. We could not find an ecommerce dataset behind it, so treat it as a stretch target, not a median. Darkroom goes further: a save rate held above 30% can mean the offers are too generous. What moves your rate is in cancel offers that work.
Failed payment recovery benchmarks
Involuntary churn is 20 to 40% of total churn, per Paddle and ProfitWell.
Start with the first charge. YOCTO's median store gets 86% of scheduled charges through on the first try, with stores ranging from 72% to 92%.
Involuntary churn falls as order value rises. Stripe's numbers:
| Order value | Involuntary churn |
|---|---|
| Under $10 | 14% |
| $10 to $100 | 9% |
| $100 to $1,000 | 6% |
| Over $1,000 | 4% |
So low-AOV brands should start here.
Recovery rate is failed payments that later paid, divided by failed payments. Across 8 brands we audited in 2026, the median brand recovered 38%, from 17.3% to 61.3%. YOCTO puts its median store at 43% in the first recovery cycle, as each app reports it, with a range of 18% to 70%. Recurly has a baseline of 49% and optimized merchants at 71%. And Darkroom cites Recurly data: 90% of recoveries land within 10 days of the failure. So the first ten days decide it.
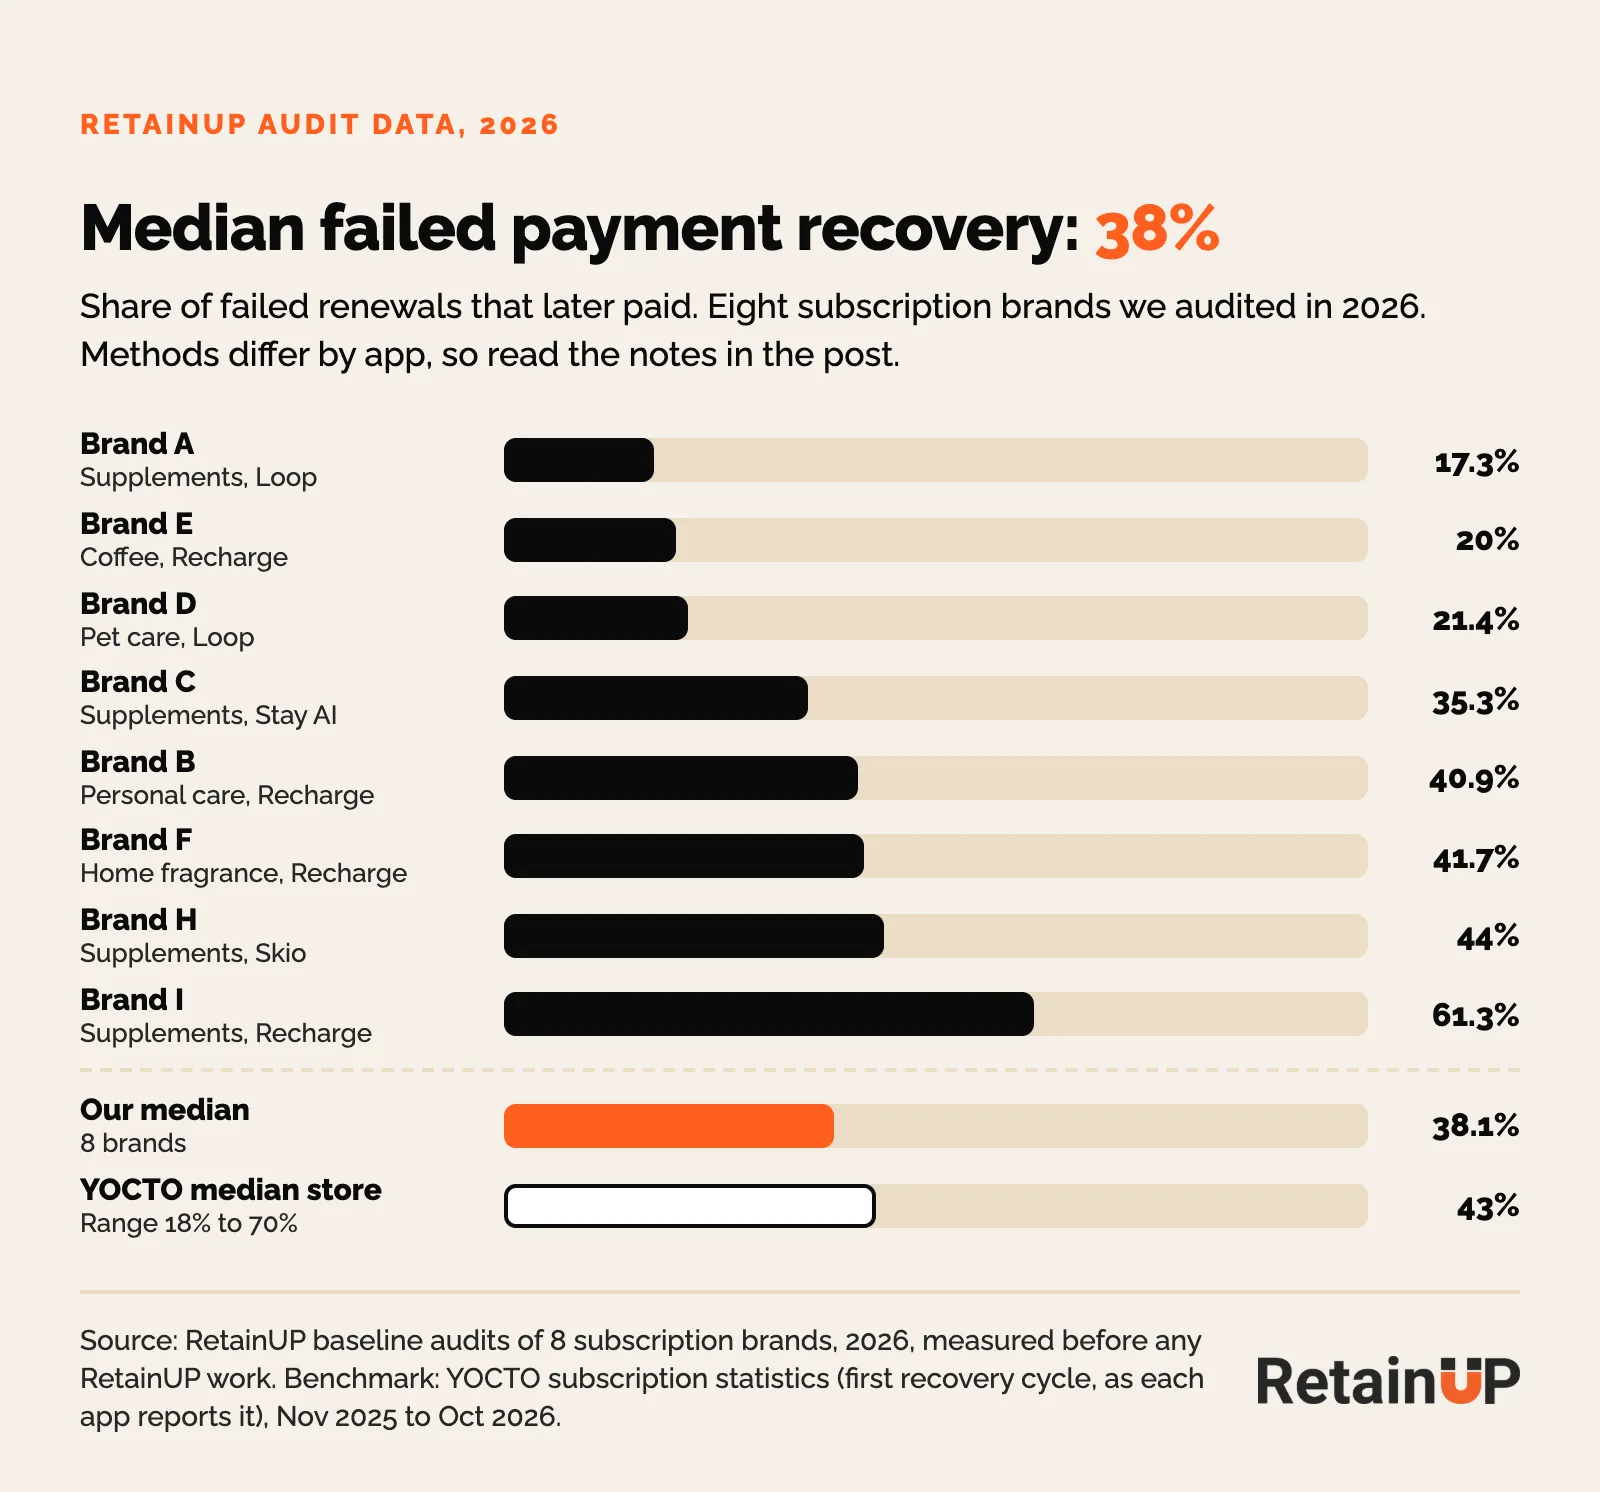
Watch the base. Loop showed 41.2% by revenue at one brand where the retry log said 17.3% of failed orders came back. Counting by order is the honest one. The fix itself, retries and the card update flow, is in failed payment recovery.
Skip and pause benchmarks
For skips, the closest benchmark is Recharge's. Of scheduled renewals on a roughly 30-day cadence, 72.3% processed, 5.8% were skipped and 17.8% cancelled. And skips cost you. 78% ordered again after a processed order. After a skip, 59%.
There is no clean published band for a healthy pause rate. The "5 to 15% paused is healthy" line goes around a lot. We traced it and found no source, so we stopped using it.
What does have a source:
- Merchants using pause see an average 9.6% save rate, across 1,700+ merchants (Recharge).
- 25% of would-be cancellers pause instead when offered (Recurly).
- 40 to 60% of paused customers churn within 90 days (Buyology). Recurly says 3 out of 4 who pause eventually return. Different measures.
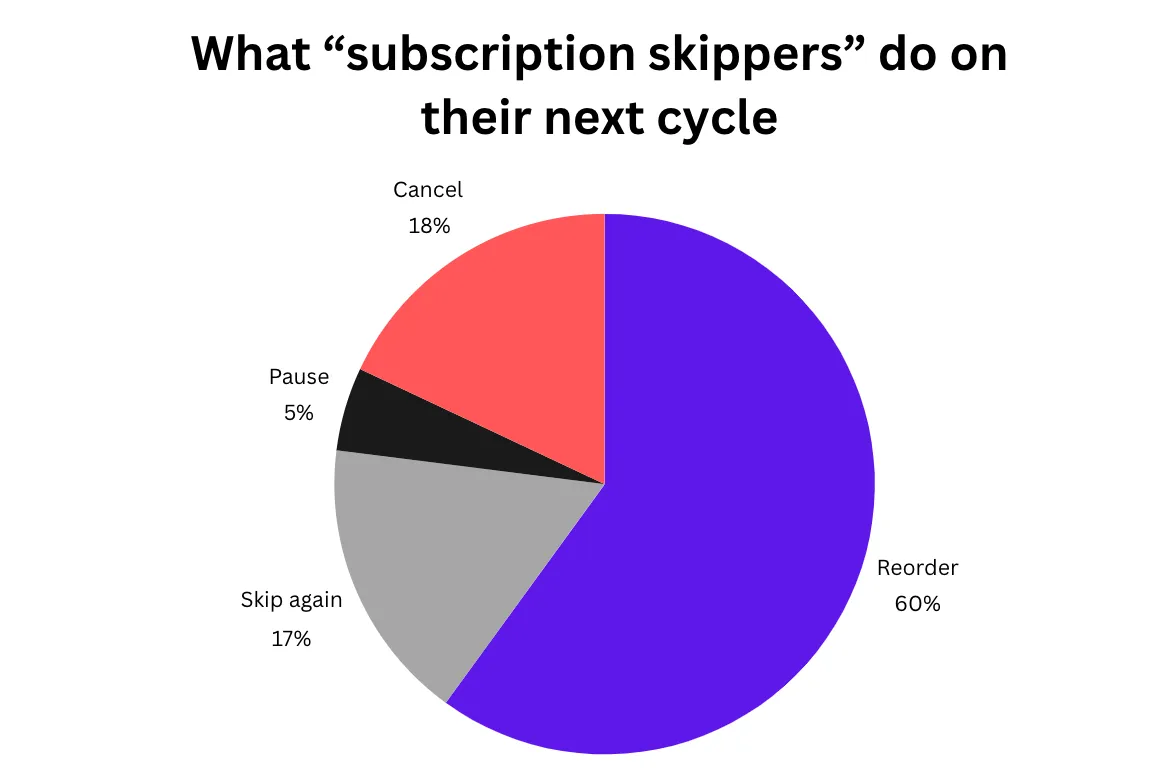
And from No Limit Email, what skippers do on the next cycle: 60% reorder, 18% cancel, 17% skip again, 5% pause. Reading your own rates as a diagnosis is in skip and pause analysis.
Every benchmark on one table
| Metric | Benchmark | Source and date |
|---|---|---|
| Take rate, beauty | 8.3% median of checkout orders | Recharge admin, Nov 2025 to Oct 2026 |
| Take rate, new customers | 25% median store (middle half 11% to 71%) | YOCTO, 2026 |
| Order 3 retention, supplements | 49.1% | Recharge, ~1,750 brands, Oct 2026 |
| Order 3 retention, audited brands | 45.6% median | RetainUP, 9 brands, 2026 |
| Monthly churn, wellness | 8.8% and rising | Recharge 2026 Trend Report |
| Monthly churn, all categories | 5.3% average, top quarter under 3% | Eightx, 2026 |
| Seasonal churn peak | 4.1 to 4.3% in Dec and Jan | Churned, 2026 |
| Cancel flow save rate | 10.8% median, saves only | RetainUP, 8 brands, 2026 |
| Involuntary share of churn | 20 to 40% | Paddle / ProfitWell |
| First-attempt charge success | 86% median store | YOCTO, 2026 |
| Failed payment recovery | 38% median | RetainUP, 8 brands, 2026 |
| Skipped renewals, supplements | 5.8% of scheduled orders | Recharge, July 2025 to June 2026 |
| Pause save rate | 9.6% average | Recharge, 1,700+ merchants |
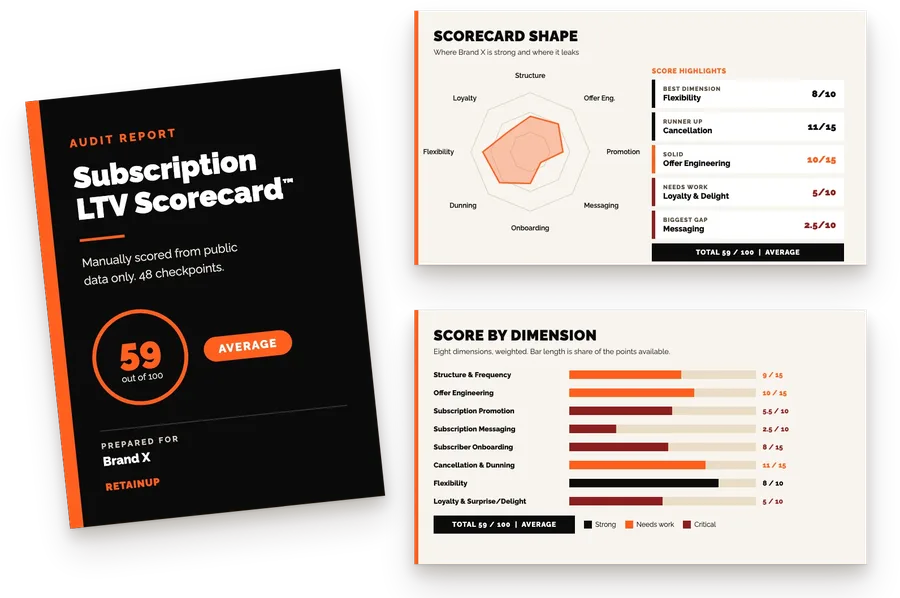
If you want to know which of these numbers is costing you the most, the Subscription LTV Roadmap™ reads your subscription data against them and gives you a 90-day plan of 30 to 50 changes in order, in 3 working days, for $1,000. For a quicker look, the free subscription audit scores 48 checkpoints and names your top 3 leaks in 24 hours.
FAQ
What is a good subscription retention rate?
For supplements on a monthly plan, around 50% at order 3 is average. We rate Order 3 retention under 45% as poor, 45 to 62% as average, 62 to 72% as good and over 72% as excellent. Recharge puts the supplement average at 49.1% and YOCTO's median store at 52%. These bands are ours, built from both reports and client cohorts, not an industry standard.
What is the average monthly churn rate for subscription ecommerce?
It depends on category. Recharge's 2026 Trend Report has wellness at 8.8% a month, beauty at 8.4%, pet at 8.1%, food and beverage at 7.7% and home at 3.9%. Across categories, Eightx puts the average at 5.3% a month, with the best quarter of stores under 3%.
What is a good cancel flow save rate?
Counted as saves only, the median across 8 brands we audited in 2026 was 10.8%, and the best was 19.3%. YOCTO reports 16% as the apps count it and 8% still subscribed a week later. The 25 to 33% figure you see quoted has no ecommerce dataset we could find behind it.
What is a good failed payment recovery rate?
Somewhere around 40% is the middle. Our audited brands had a median of 38%. YOCTO's median store recovers 43%. Recurly puts optimized merchants at 71%. Check whether your app counts recovered revenue or recovered orders first, because the revenue number can read more than twice as high.
Why do Recharge and Skio give such different retention numbers?
They count differently. Recharge's data on about 1,750 supplement brands puts order 3 at 49.1%, while Skio says only 20 to 30% are left. Skio publishes no method, and its number only matches Recharge if $0 trials sit in the denominator.
One email a week on subscription retention: the numbers, the strategy, and what to fix first.

Rahi Jain
Rahi Jain is a subscription LTV specialist who helps $1M to $10M DTC brands reduce subscription churn and maximize LTV on Recharge, Skio, Stay AI and Loop.
More about Rahi