Key takeaways
- Every subscription number sits under one of three pillars: subscriber base growing, subscriber loss shrinking, subscriber value increasing.
- Recharge data on about 1,750 supplement brands puts order 3 retention at 49.1%. Our 9 audited brands had a median of 45.6%.
- At $27 gross profit per order, the simple churn formula gives $338 of LTV. The cohort actually paid $137 in 12 months.
Ask your subscription app how retention is going and you get a number. Ask Shopify and you get a different one. Ask your agency and you get a third.
None of them are lying. They just count different things.
So this guide walks every number a subscription brand should watch, in the order you run into them. What each one means, how to count it, and where it flatters you. It is the measurement part of our subscription LTV guide. Formulas, benchmarks and diagnosis live here. The fixes live in the other hubs.
One thing first. The main metric is LTV. Everything else can be fudged, pushed up or pushed down. And LTV takes a year to show up, which is why we watch an early number that predicts it.
The three pillars every subscription number sits under
There are dozens of subscription KPIs. Each sits under one of three questions.
| Pillar | The question | The numbers under it |
|---|---|---|
| 1. Subscriber base growing | How many new subscribers are coming in, and how many lost ones are coming back? | Share of orders that start as subscription, share of one-time buyers converted, share of churned subscribers reactivated |
| 2. Subscriber loss shrinking | Where and why are subscribers leaving? | Active churn, passive churn, month 0 churn, order 2 and order 3 retention, cancel flow save rate, payment recovery rate |
| 3. Subscriber value increasing | How much is each subscriber worth over time? | Checkout AOV, recurring AOV, retention by order, subscription MRR, net subscriber growth |
Month 0 churn is everyone who cancelled before their first renewal ever fired. That one is an onboarding failure. The product never got a chance.
Net subscriber growth is new plus reactivated, minus cancelled, minus passive. It is the single number that tells you if the program is growing at all. And most dashboards never show it in one place.
On the value side, checkout AOV is what a subscriber starts with. Recurring AOV is what they settle into. And subscription MRR is the recurring revenue this month. Count what was collected. Eightx warns that app MRR often keeps paused and skipped subscriptions in.
One more value number: net revenue retention. Take what a cohort paid at the start of a period, add upgrades, add-ons and resumed subscribers, take off downgrades and cancels, and divide by the start. Shero Commerce found no published benchmark built on DTC data, and showed that holding paused subscribers at full value lifts the number by about 5 points. So compare it with your own earlier cohorts.
If your pillar 1 is weak, the work sits in the take rate hub. Pillar 2 is the churn and retention hubs. Pillar 3 is mostly offer and add-ons. This hub only measures.
Which numbers to watch weekly, monthly and quarterly
Not every number moves at the same speed. Check a slow one every week and you just see noise.
Weekly
Take rate on your own store, new orders only. It moves fast. A widget or product page change shows up inside a week.
And if you have an offer test live, read revenue per visitor and new subscribers per 100 sessions by day. Our rollback number is revenue per visitor down 15% after three days. Agree it before you launch.
Monthly
This is the health dashboard we keep for every brand:
- Active subscribers, counted as people who paid, not people who did not cancel. And people, not subscriptions, so one customer on two plans counts once
- Subscription MRR, as cash collected
- Net subscriber change, additions against losses
- Active churn rate and passive churn rate, side by side
- Cancel flow save rate
- Payment recovery, recovered orders over failed orders, from the log
- Cancel reasons, as a share of all cancels, month by month
- The next 30 days of scheduled orders, in revenue and in units to ship, less the skips you expect
That last one is the forward book. It keeps stock planning honest. And it shows the gap between what is scheduled and what gets charged. Loop says brands lose about 15% of that revenue to skips and pauses before a charge is even tried.
Pause rate we dropped as a target in October 2026. Track it only for brands that keep pause.
Quarterly
Order 3 retention on mature cohorts, 12-month LTV and CAC payback. They need cohorts to age before they say anything, so a monthly look mostly shows you cohorts that are not finished yet.
Order 3 retention: the one number we track first
So I track one number for every brand we work with. Order 3 retention.
It is the subscribers who paid order 3, divided by the subscribers who paid order 1, in the same cohort. A cohort is everyone whose first order landed in the same month.
Example: 400 subscribers paid their first order in March. 236 of them paid order 3. 236 ÷ 400 = 59%. That sits in our average band for supplements.
Why order 3? Order 2 can be an accident. They forgot they subscribed, or never knew. Order 3 is different. It is paid by someone who knew what they bought and used it. And most churn has already happened by then. Loop puts 68% of all subscription churn in the first three orders.
Six rules keep it honest: mature cohorts only, count by order, start from the first paid order, leave out failed payments in retry, set a rule for pauses and skips, and leave out imported subscribers. Each rule, and where to find the number in Skio, Loop and Recharge, is in order 3 retention: the one number to track.
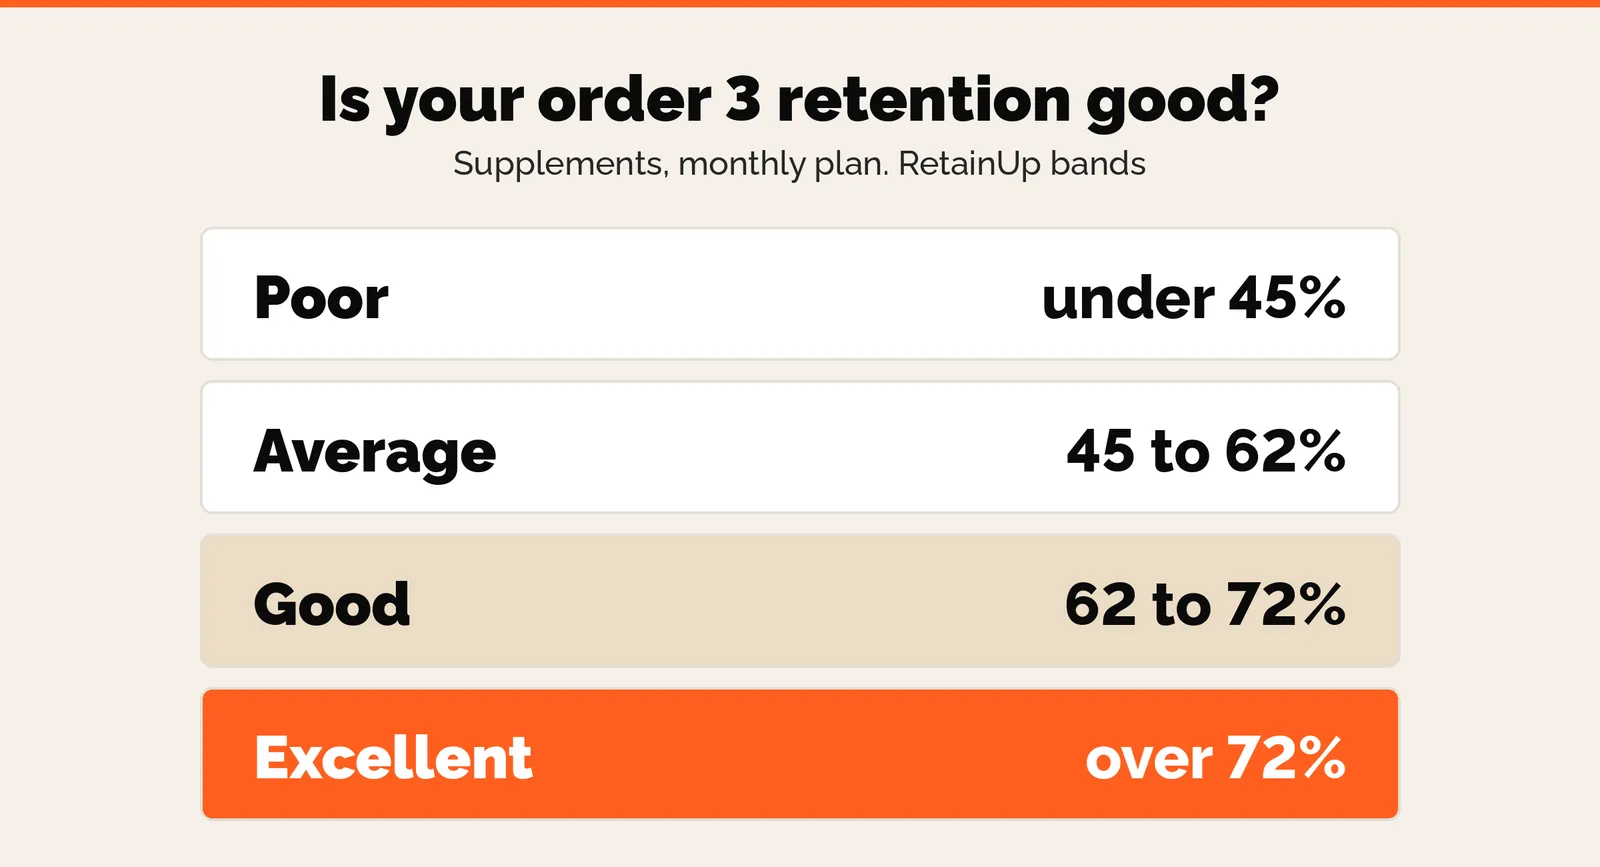
These are our bands, not an industry standard. Nobody has published one on a clear definition yet.
And if order 3 is low, check order 2 first. The fixes by order number are in getting past order 2 and order 3.
Subscription retention rate formulas, and what each one hides
If you Google retention rate, you get this. Customers at the end of the period, minus new customers added, divided by customers at the start.

Fine for SaaS. Weak for subscriptions. Two reasons. New subscribers land in the same period and hide the ones you lost. And it runs on calendar time, while your subscribers decide on their order date.
Then there are the numbers your tools show you. Each measures something different:
- Shopify returning customer rate counts anyone who ever came back, so a 2021 buyer who returned last week counts as returning.
- 30, 60 or 90 day retention blends plans. At day 90 a monthly subscriber is on order 3 and a quarterly one is still on order 2.
- Month 1 retention counts skipped and paused subscribers as retained. Thomas Lalas wrote about a founder proud of 90% month one retention. A third of those "active" subscribers had skipped their last three orders.
- Monthly churn partly measures how often you bill. A weekly biller faces the stay-or-go decision 50 times a year, a quarterly biller 4.
Churn is also seasonal. Churned's 2026 report puts the peak in December and January, at about 4.1 to 4.3% a month, against 3.2% in November. So compare January with last January.
Churn itself comes in cuts. Customer churn counts people. Revenue churn counts the dollars they took with them. Gross churn ignores the subscribers who came back, net churn takes them off. Eightx works out that those choices, plus monthly or annual, give 16 different churn numbers from the same data. Pick one, write it down, and keep it.
Every formula, how to calculate it by hand and how to read it in a cohort table, is in how to calculate subscription retention rate.
Take rate: count only the orders where someone chose
Take rate is the share of your buyers who choose subscription. Simple enough. And almost every dashboard I open gets it wrong, because it divides by the wrong thing.
We report it two ways in every audit. Purchase take rate is subscription starts over eligible purchases, meaning any order that was not a recurring charge. Customer take rate is new subscriptions over first-ever customers. On a healthy program the two land within a point or two.
The mistake I see most is leaving recurring charges in. A recurring charge was never a decision. On one of our brands, the same five months read 60.4% with recurring orders included and 44.5% without. Big gap. And the inflated version climbs on its own as the base grows, which flatters a program that is not improving at all.
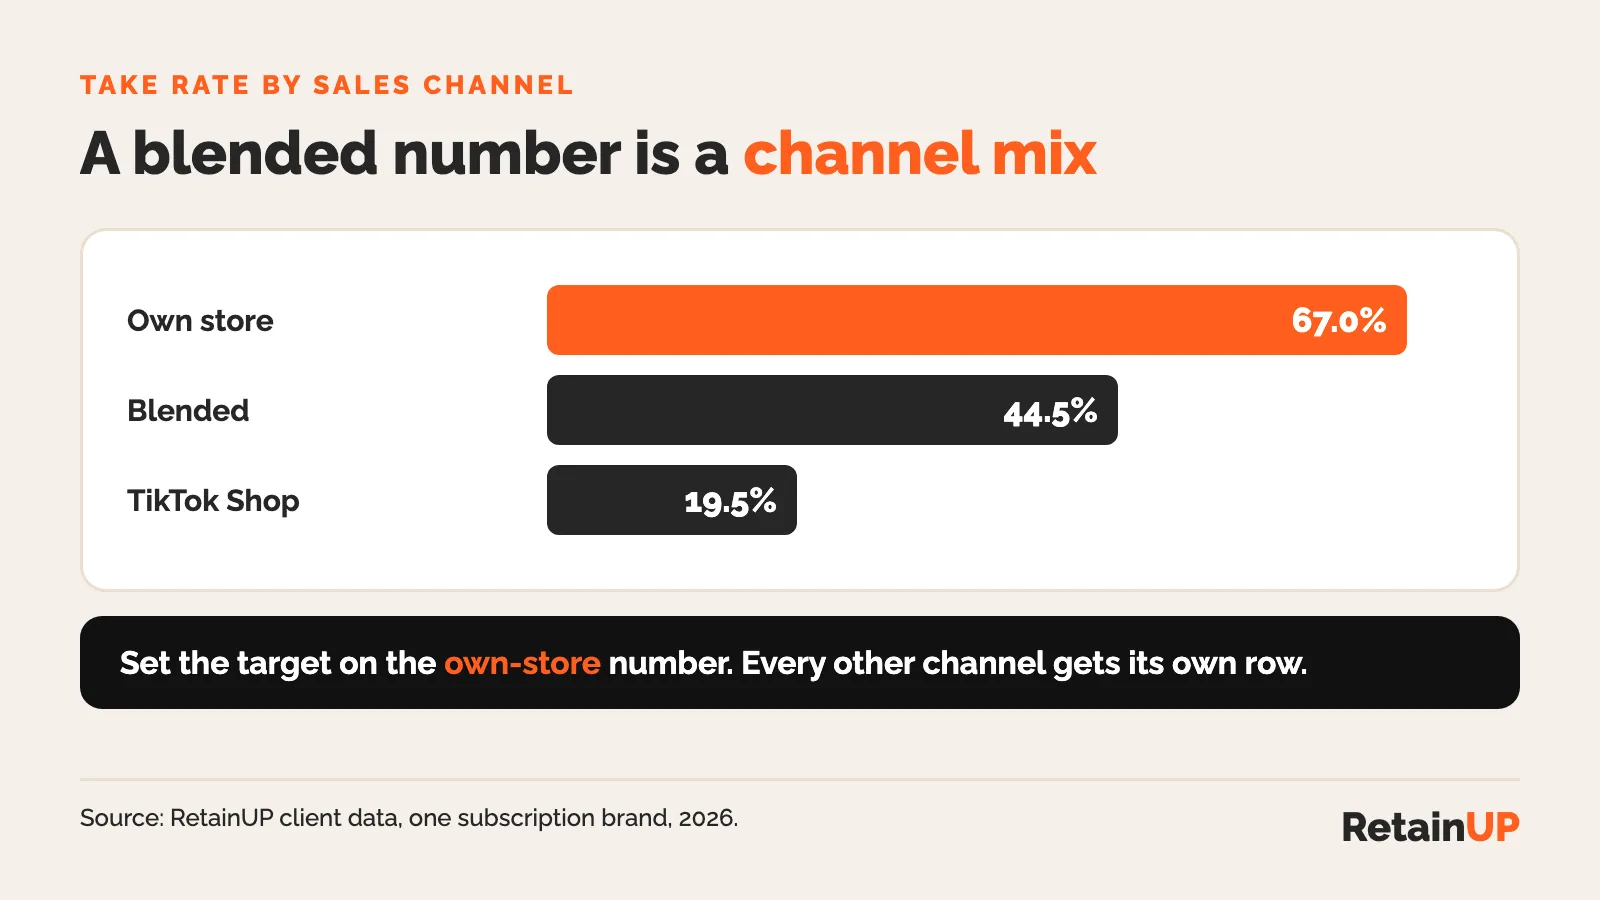
A blended take rate is a channel mix, not a measurement. That brand read 44.5% blended, 67.0% on its own store and 19.5% on TikTok Shop. So set the target on the own-store number.
And take rate bought with a deeper discount is a different number from take rate earned with a clearer offer. One brand hid its one-time options and take rate went from 42% to 58%. Revenue a day fell 42% in the same three days. Ouch. Both cuts, the channel split and where to pull the data are in the subscription take rate formula. How to raise it lives in the take rate guide.
12-month LTV: the cash a cohort already paid
Ask a founder for their subscription LTV and you get a number in about two seconds. Ask how they got it and it is nearly always the same sum. Monthly revenue, times margin, divided by the churn rate on the app dashboard.
I open 10 to 20 cohort charts a month across different brands. The number the founder quotes is almost always higher than the cash the cohort paid. Often twice as high.
12-month LTV is the gross profit a subscriber cohort pays you in its first 12 months, counted from the first paid subscription order. Gross profit, not revenue. Subscribers, not customers. And 12 months, because a brand funding growth from its own cash cannot wait 36.
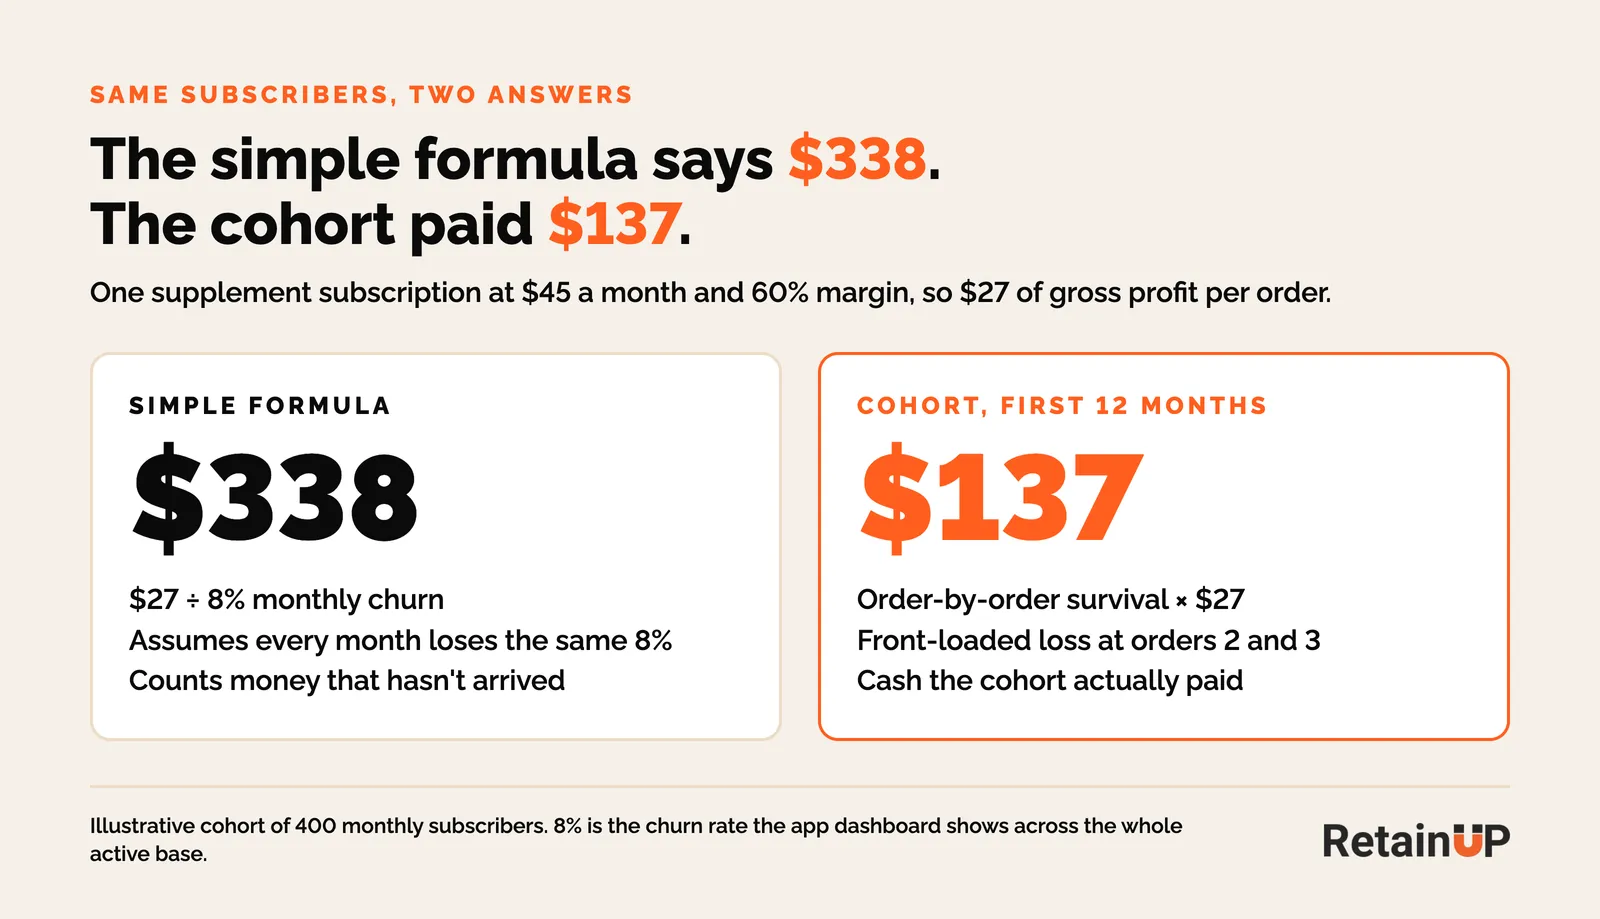
The cohort way: take everyone whose first paid order landed in the same month, count what share paid each order after that, multiply each share by gross profit per order, and add it up to order 12. In our worked example, 400 March subscribers at $27 an order come to $136.89 each.
Predicted LTV from Klaviyo, Lifetimely or Yotpo is worse. Eightx puts it at 20 to 40% above actual cohort LTV. So run actual and predicted side by side until they agree within 10%. Until then, trust the cohort.
The LTV figures Skio and Loop print are revenue, so take your margin off first. No subscription app report at all? Shopify has a free one under Analytics, Reports, Customer cohort analysis. It shows amount spent per customer by month. But it counts every customer and every order, so it cannot give you order 3 for subscribers.
The full method and the five calculation mistakes I see in audits are in 12-month subscriber LTV: how to calculate it.
CAC payback and LTV to CAC
What will make you reach $100m faster? Higher LTV or a faster CAC payback period?
Faster payback. No doubt. Always. Get your money back in 60 days and the same cash buys six customers a year. Take 180 days and it buys two, even if each of those two is worth more.
Take a subscriber at $45 a month and 60% margin. That is $27 of gross profit an order, and you paid $60 to acquire them. Order 1 returns $27. Order 2 takes you to $54. Order 3 clears the $60, around day 60.
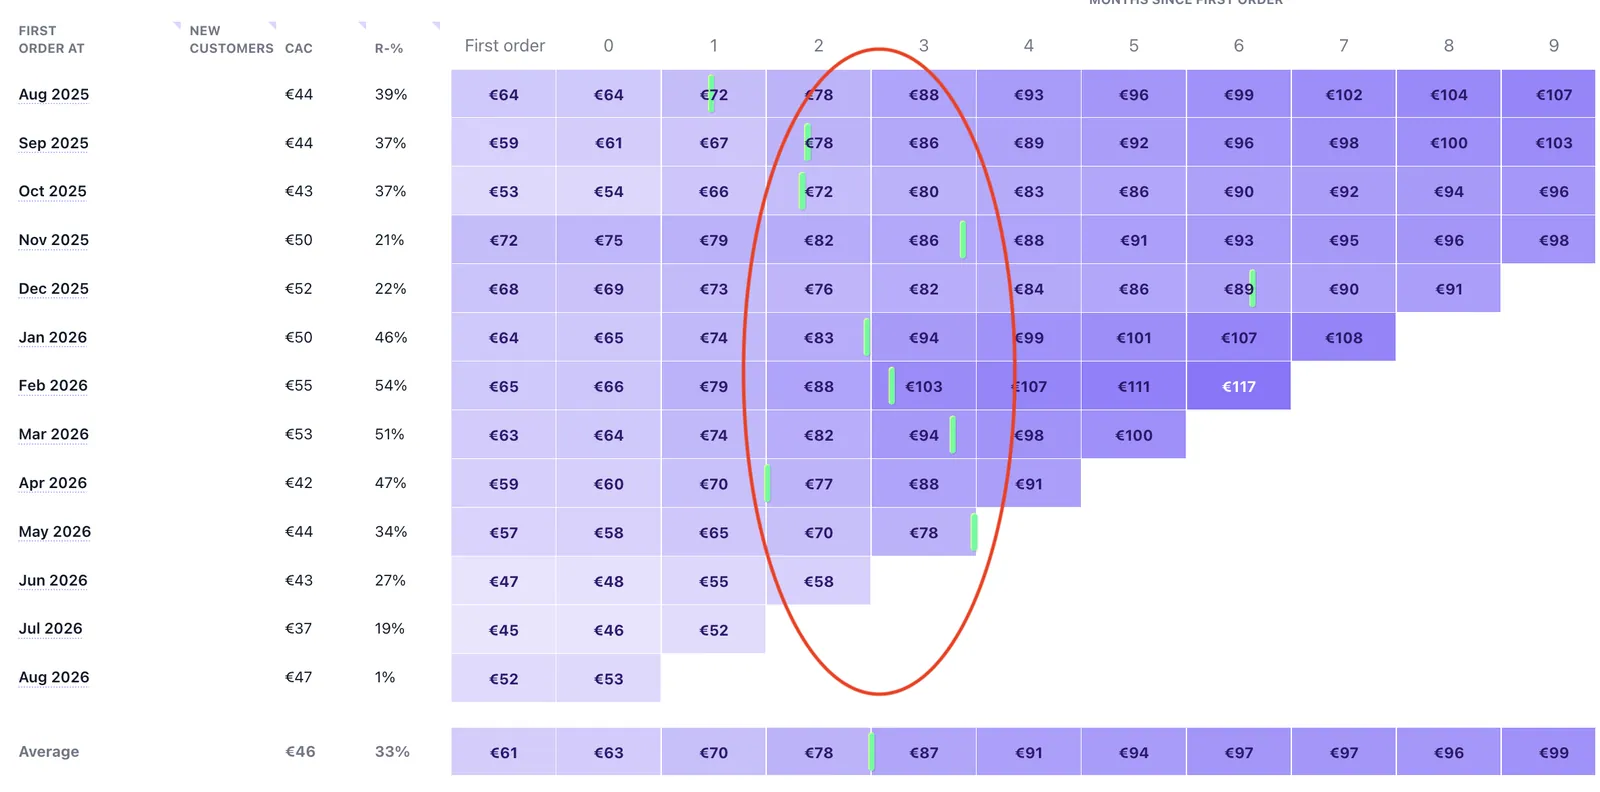
What good looks like: payback by order 2. Order 2 pays you back and everything after it is profit. That is inside 31 days on monthly billing and inside 91 on quarterly. Past 90 days you are funding acquisition from savings, a credit line, or someone else's money.
A good LTV to CAC ratio is 3:1 to 4:1, on 12-month gross profit. And it only works if LTV is counted right. A 3:1 on lifetime numbers can be 1.4:1 over the first 12 months. Same subscriber. So read the ratio next to payback, never alone. The bands, the cohort version and what moves payback fastest are in CAC payback and LTV to CAC.
Active vs passive churn, and the active count under both
Every subscription founder I talk to is watching the same number. Monthly churn rate. And fixing the wrong thing.
Churn is two numbers. Active churn is a subscriber cancelling. Passive churn is a payment that fails and never recovers. Nobody decided to leave. Our rule for the split: passive means the subscription was in payment recovery when it cancelled. Active is everything else.
The split decides which work comes first. Paddle and ProfitWell put failed payments at 20 to 40% of churn. But one Loop brand we audited ran 96 to 99% active churn every month. A better dunning flow would barely have moved it.
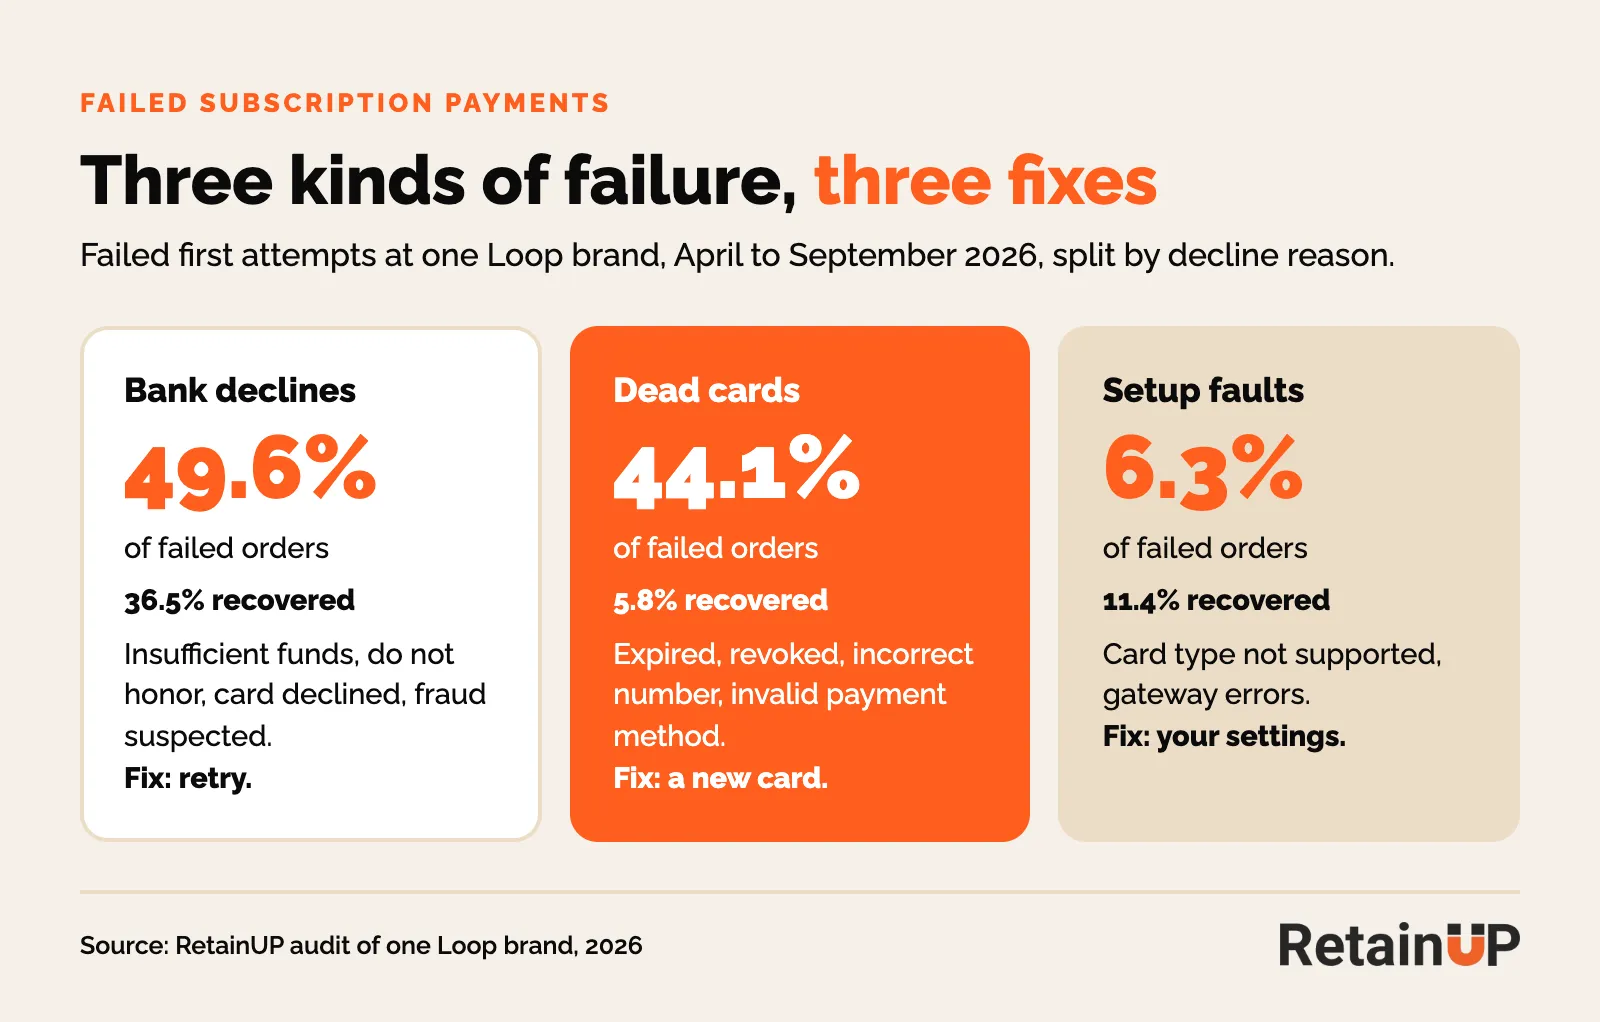
Then check the recovery rate your app reports. On one Loop brand, Loop's own first-cycle recovery read 41.2%, by revenue. The transaction log read 17.3%, by order. Same failed payments. Different rule.
And check the denominator. Your app counts everyone who has not cancelled as active. At one Loop brand, about 9% of the subscriptions marked active had not paid since their card first declined. Serial skippers, long delays and paused lines sit in there too. Want the short version? Count subscribers who paid in the last billing cycle. How to classify blank cancels and rebuild the real count is in active vs passive churn. The fixes live in the subscription churn guide.
When subscribers cancel: the three spike days
I pulled every cancelled subscription from one brand. Every single one they have ever had. Instead of counting cancellations by month, I counted them by day. Cancelled date minus start date.
Most cancellations happen on three days. And none of the three is about the product.
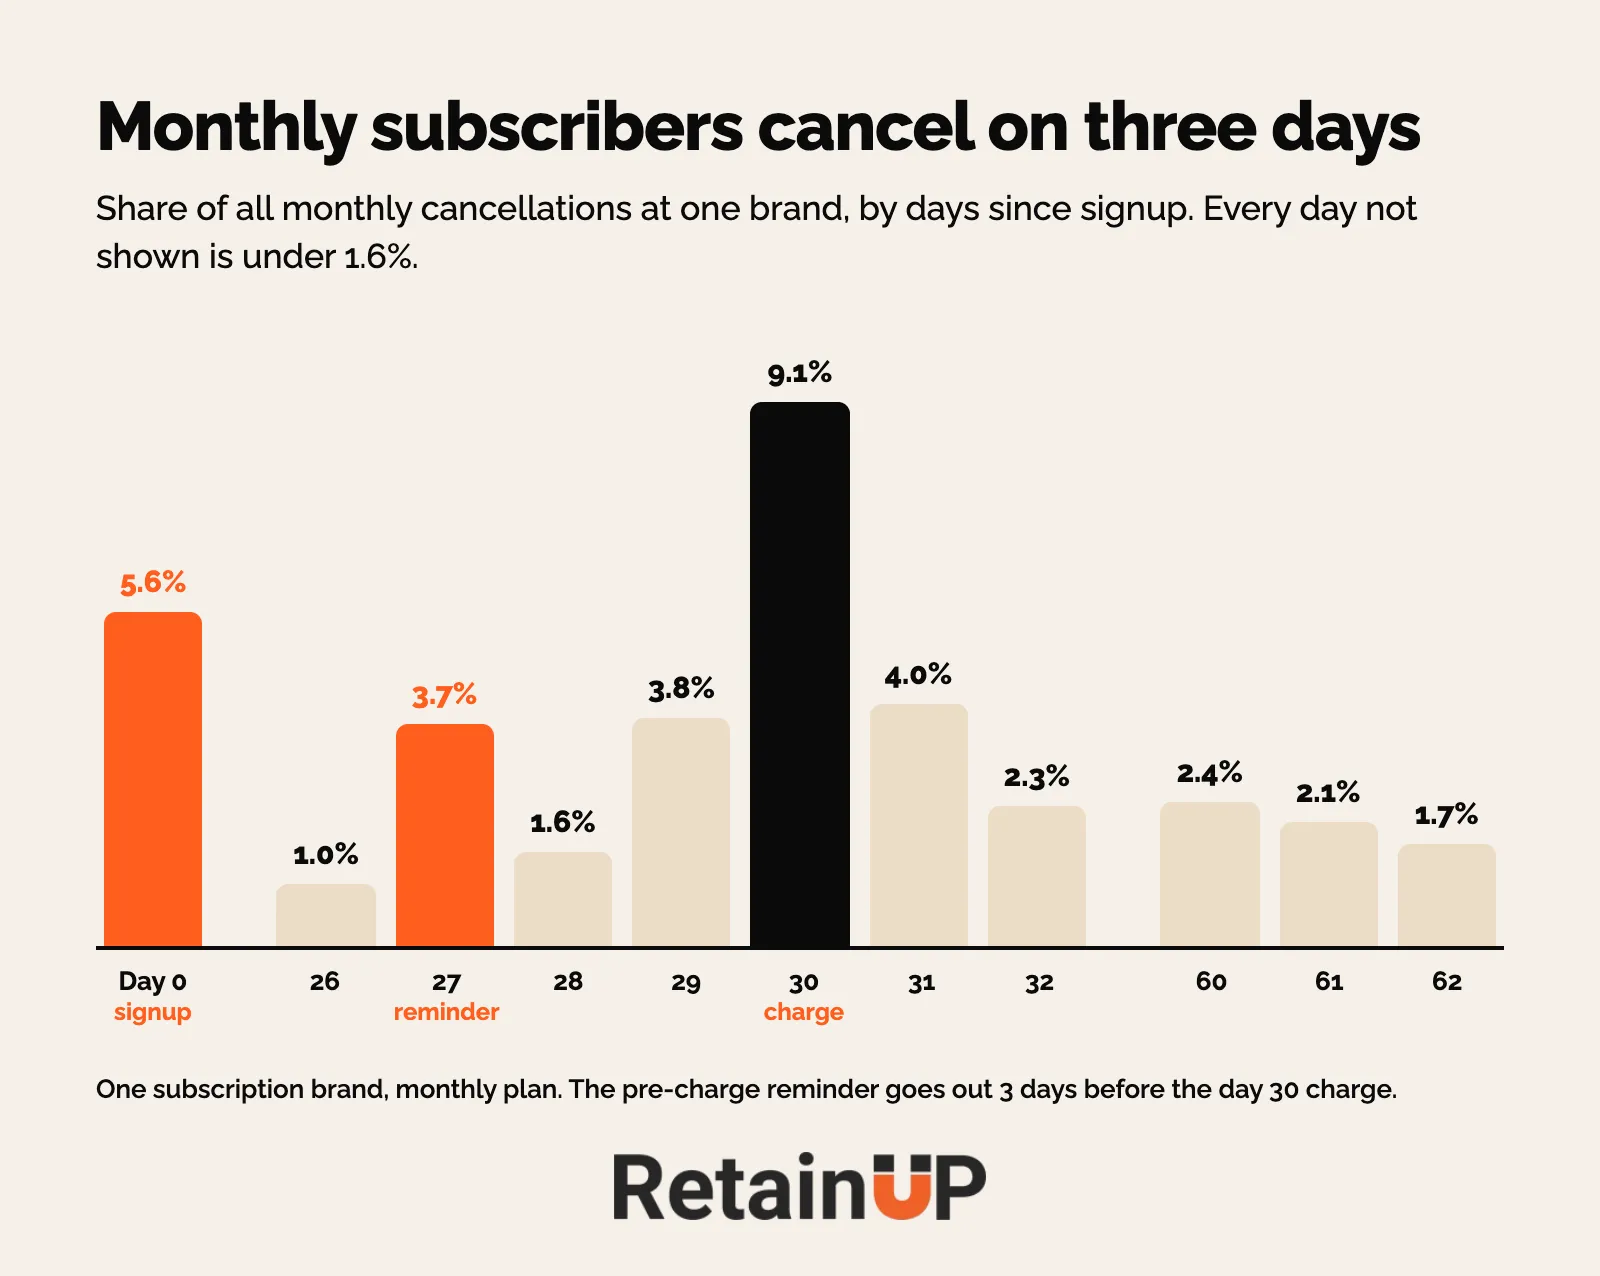
- Day zero. They cancel the day they subscribe, 5.6% to 8.4% at every frequency. That is the price of your offer.
- The reminder. Day 27 for monthly subscribers held 3.73% of monthly cancels, against 1.02% the day before and 1.57% the day after. Behaviour does not do that. Behaviour is smooth. A spike with two quiet days around it is a send.
- The charge. Day 30 held 9.11% of every monthly cancel, the biggest single day.
For the reminder itself, track the pre-rebill cancel rate: subscriptions cancelled in the 3 days before a scheduled rebill, divided by rebills due. How to build the chart in about 20 minutes and read each spike is in cancellation day spikes.
Reading a cohort chart without fooling yourself
Most subscription brands have a cohort chart. In Triple Whale, in Recharge, Skio or Stay AI, and even in Shopify. Most open it once, get confused, and never go back.
The chart needs three reads. Across a row is what one cohort does over time. Down a column compares acquisition months at the same stage, and it is the only way to tell if your fixes worked. The diagonal is the calendar: same month, different cohorts.
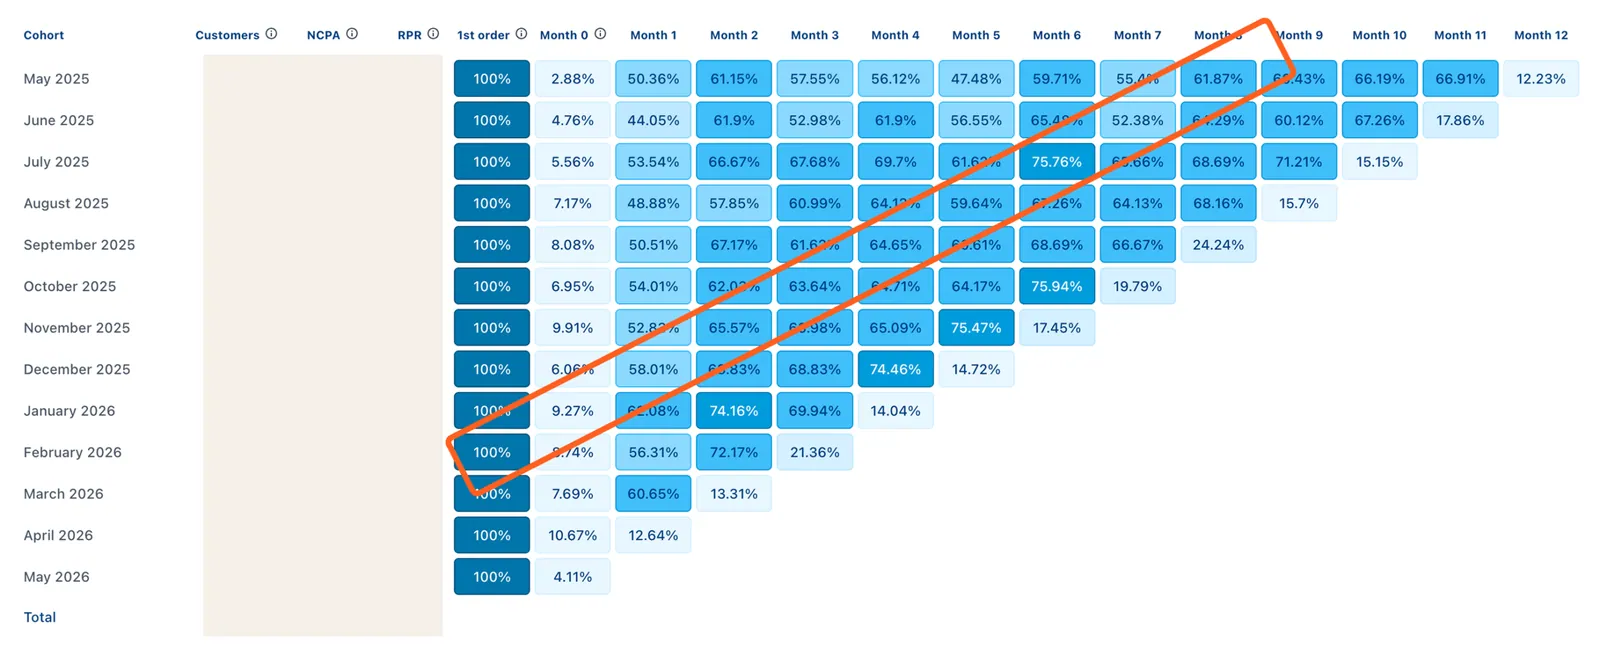
Then the rules. Three of them. Read by order number, not month. Compare like-aged cohorts only. And put the count next to every rate. A reader sees 62.4% at order 2 and 64.5% at order 3 and thinks two thirds of the cohort is left. Only 40.2% is. The count shows it.
On one of our brands, order 1 to order 2 stayed flat at 62 to 71% across every cohort, while order 2 to order 3 fell from 64.5% to 57.1% to 47.9% over three intakes. The overall rate buried that. The full method, with splits by offer, product and plan, is in subscription cohort analysis.
Take rate, retention or acquisition: what to fix first
Every subscription founder opens with the same question. "Why are people cancelling?" Almost nobody asks the other one. "Why are so few people subscribing in the first place?"
Take rate applies to every single person who buys. Order 3 retention applies only to the people who got that far. In a young base, a retention fix touches a slice.
| Change | From | To | Active base after |
|---|---|---|---|
| Raise take rate | 50% | 70% | About 7,000 |
| Raise Order 3 retention | 40% | 70% | About 6,500 |
That is a brand at 5,000 active subscriptions. Less growth from retention. And far harder to earn. You wait three months before the number even moves.
Buying more buyers is the other trap. Say you spend $100K a month on ads and lift it to $150K. CAC goes from $50 to $80, and the profit disappears.
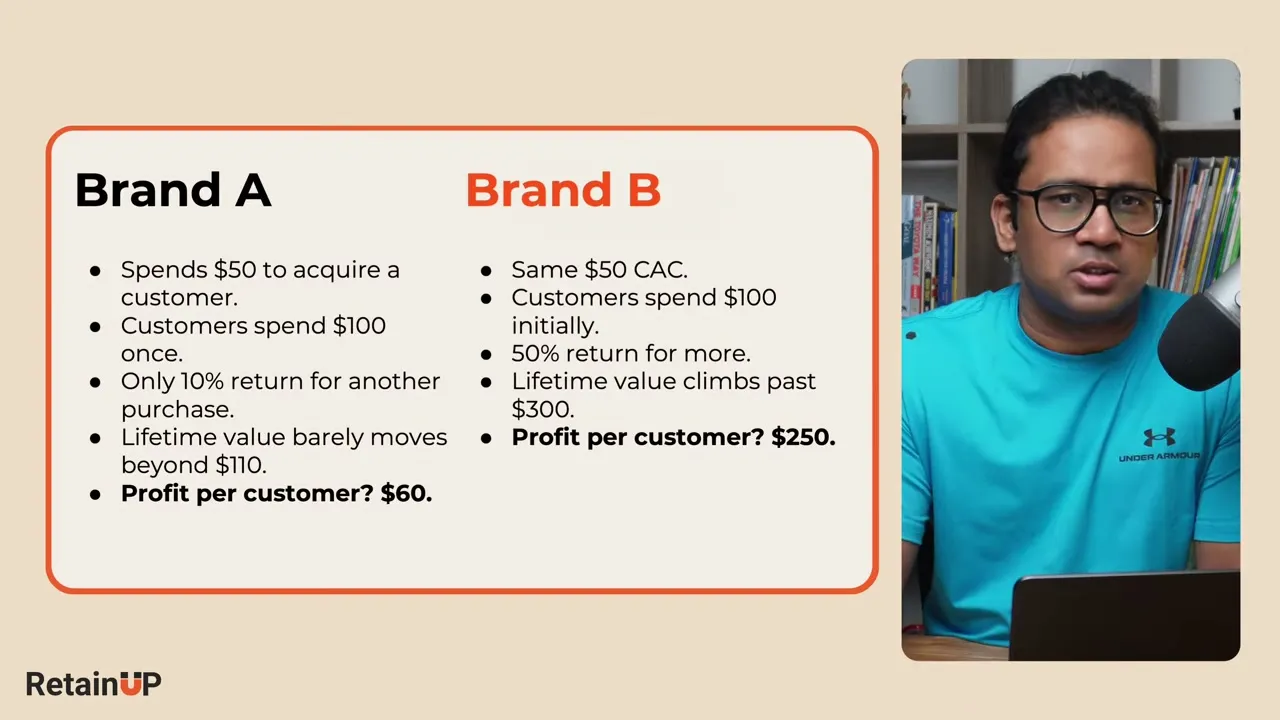
So the order for a $1M to $10M brand: take rate, then onboarding, communications and the cancel flow, then winbacks. Paid acquisition comes first only when the base already retains. The math and the exceptions are in take rate, retention or acquisition: what to fix first.
Benchmarks, with the definition attached
Ask two subscription apps what good retention looks like for a supplement brand.
Skio says 70 to 80% of supplement subscribers churn before order 3. So 20 to 30% are left. Recharge looked at about 1,750 supplement brands, and 49.1% were still there at order 3. Same category. Same order. The answers are twice apart.
Some count subscriptions and some count subscribers. A number without its definition is just a number.
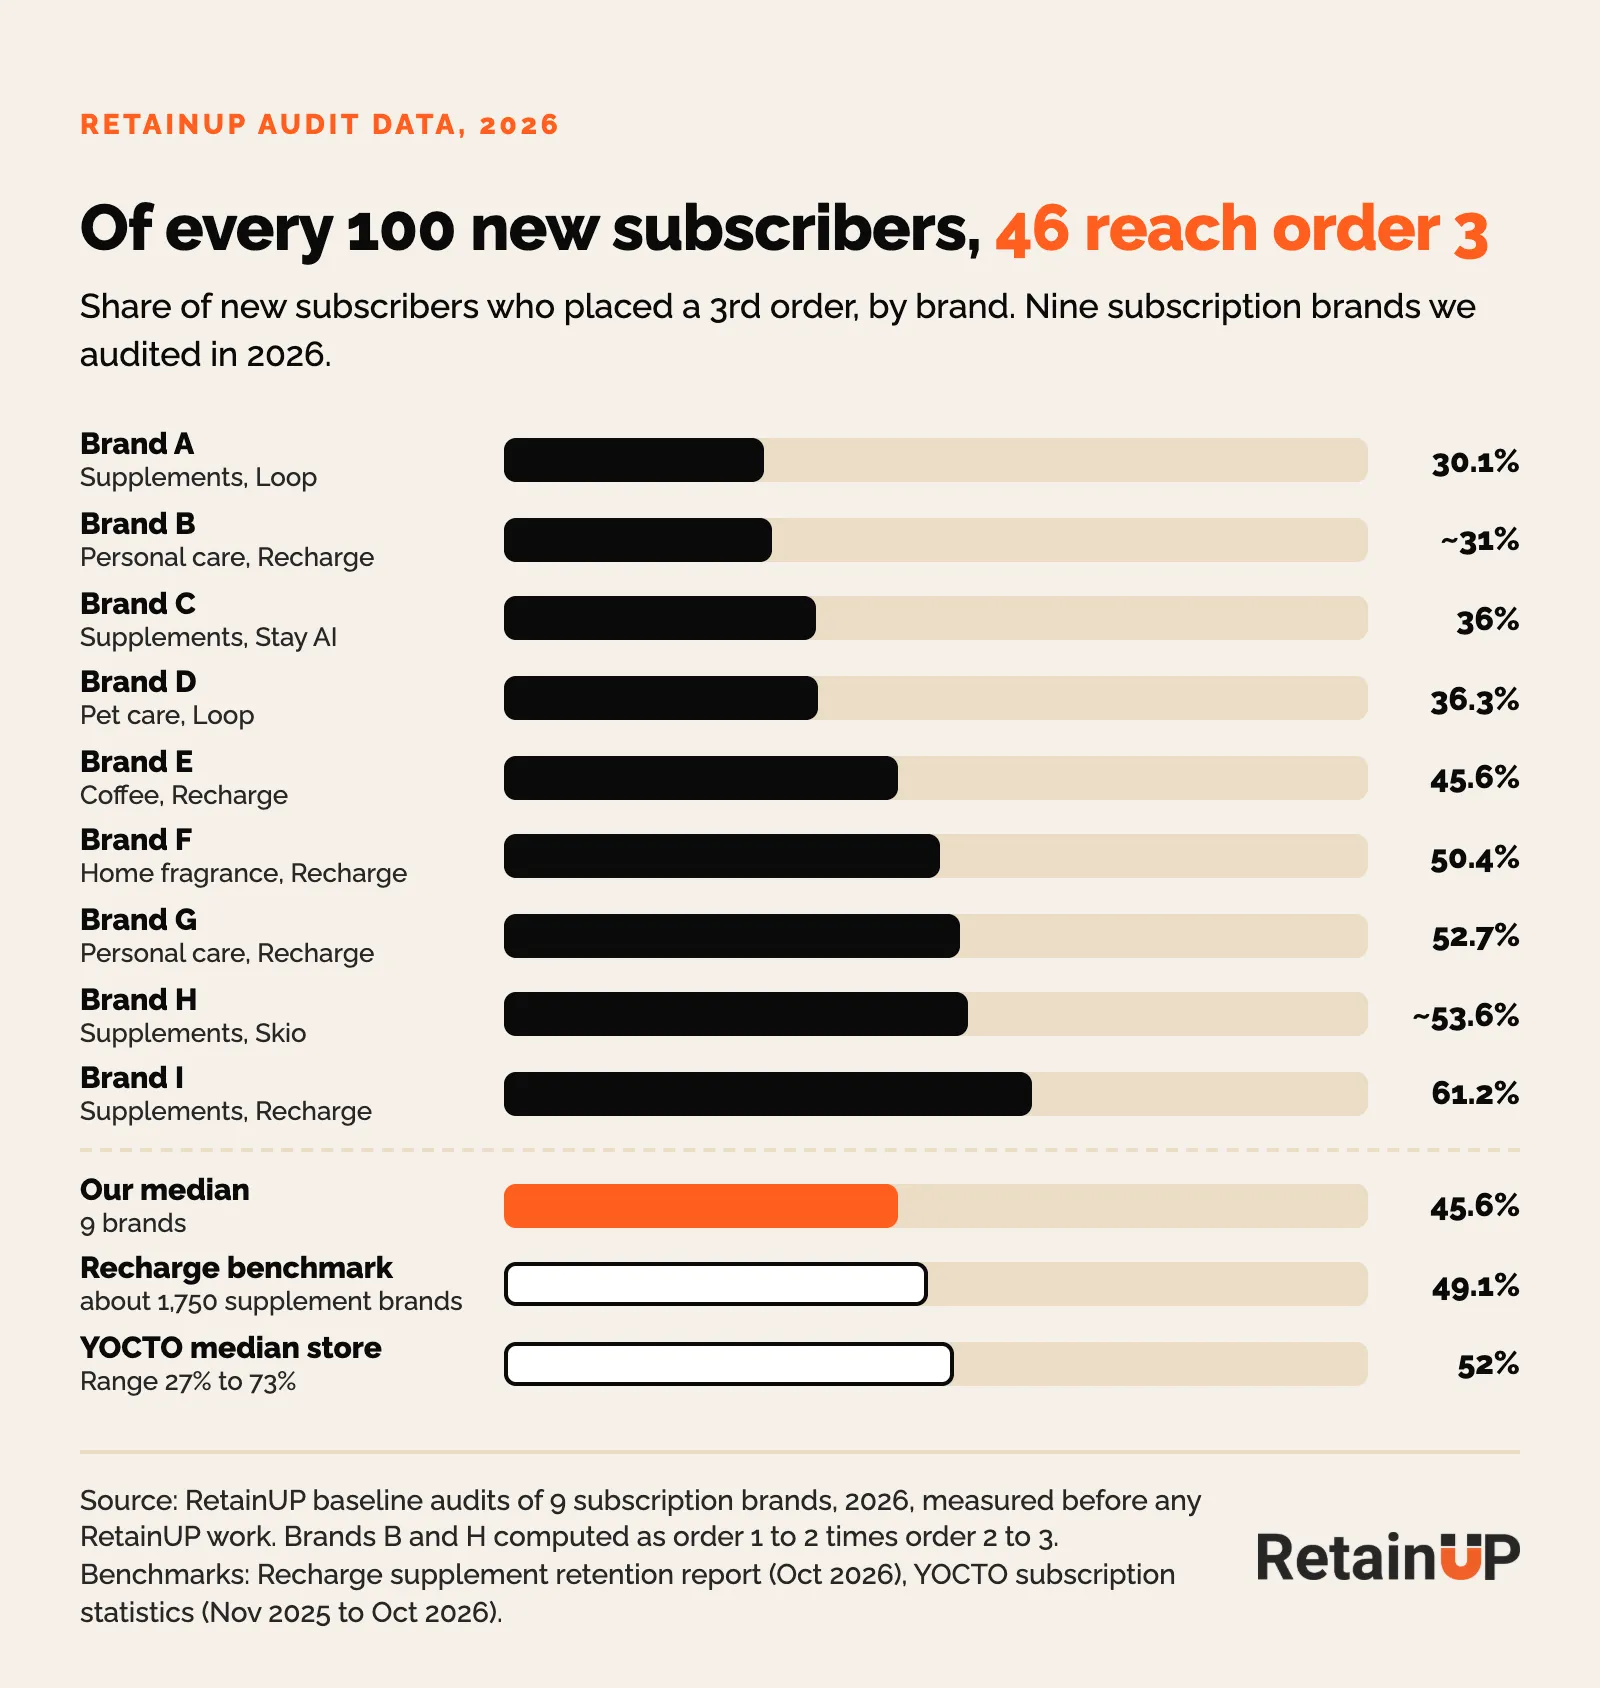
Across 9 brands we audited in 2026, before we changed anything, a median 45.6% of new subscribers reached order 3. Nine brands is a small sample. And brands that hire a retention consultant often have a problem. So it may run low. YOCTO's median store keeps 52%.
A few more we use: wellness churns 8.8% a month in Recharge's 2026 Trend Report, the highest of any category. The median cancel flow across 8 of our brands saved 10.8%, and the median brand recovered 38% of failed payments. Every benchmark, with source and date, is on subscription benchmarks.
Skip and pause: a pressure valve or a cancellation on a timer
For some brands skip and pause are a pressure valve. For others they are a cancellation on a timer.
Classify by who acted before counting anything. At one pet care brand on Loop, dunning had parked failed payments as pauses. Counted as customer pauses, they roughly doubled the paused rate. Those belong with passive churn.
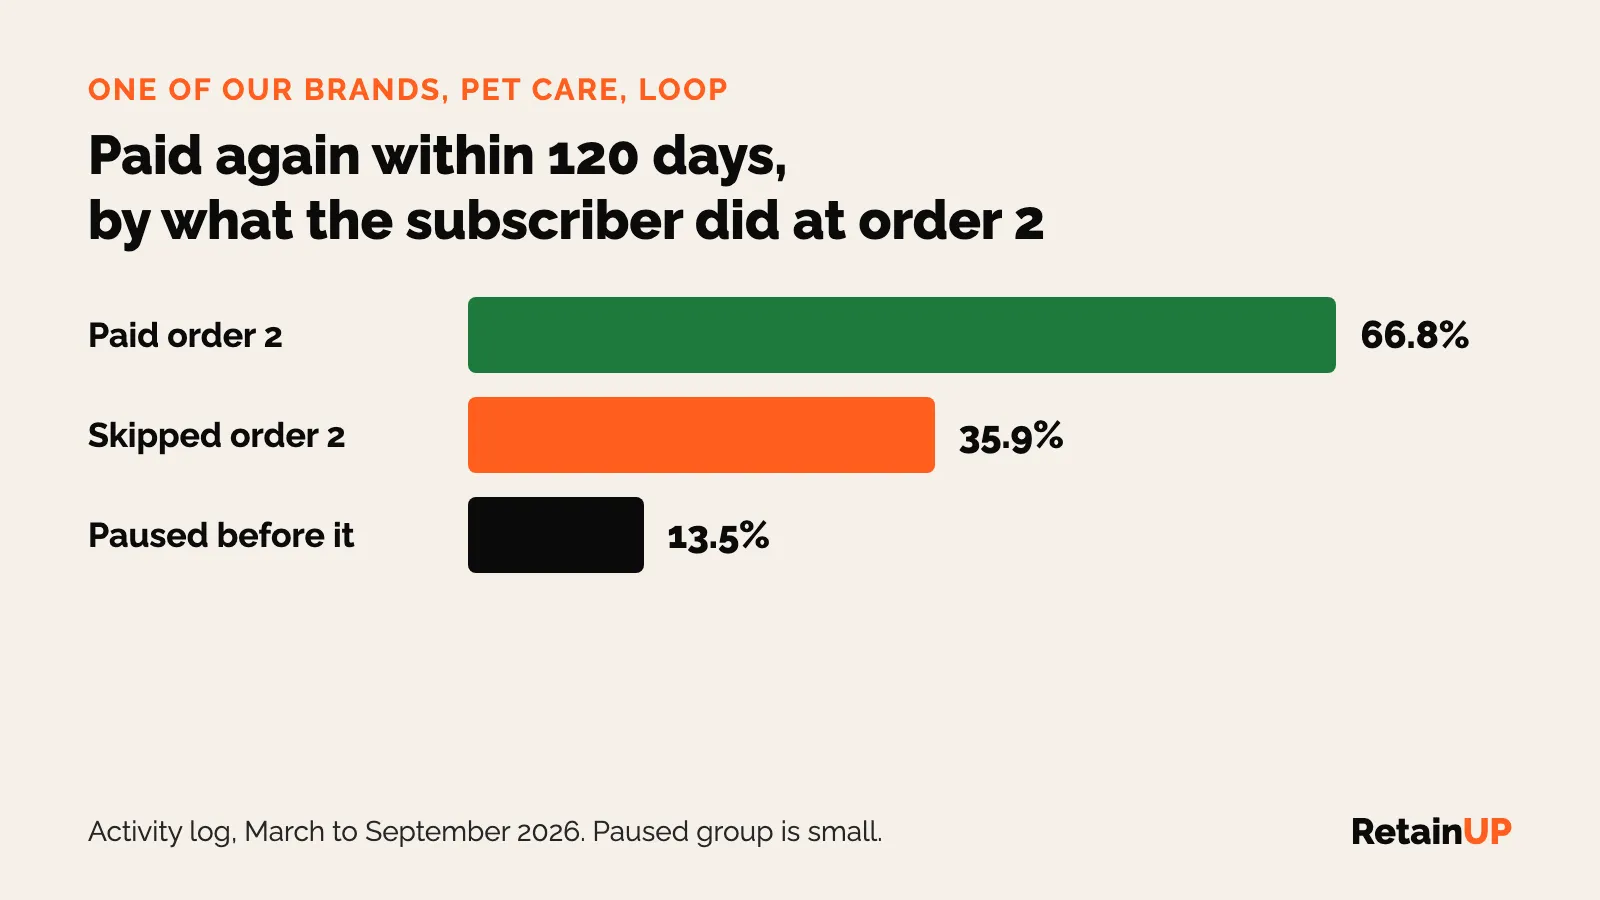
Then measure paid again, with a window longer than the pause. At that brand, 66.8% of subscribers who paid order 2 paid again within 120 days. Of those who skipped it, 35.9%. Of those who paused before it, 13.5%. Small group. Big gap.
For replenishment brands, my rule of thumb is 3% to 5% of the base on pause. Above 5%, product is building up and the habit is broken. The denominators and the three diagnoses are in skip and pause analysis. What to offer, in rank order, is the flexibility ladder.
A/B testing a subscription program
Most subscription brands test subject lines. Very few test the cancel flow, the product page widget or the billing reminder, and those are where a subscription program wins or loses money.
The rule: change one thing, wait four weeks, read the result, move on. Four weeks covers a full billing cycle for monthly subscribers.
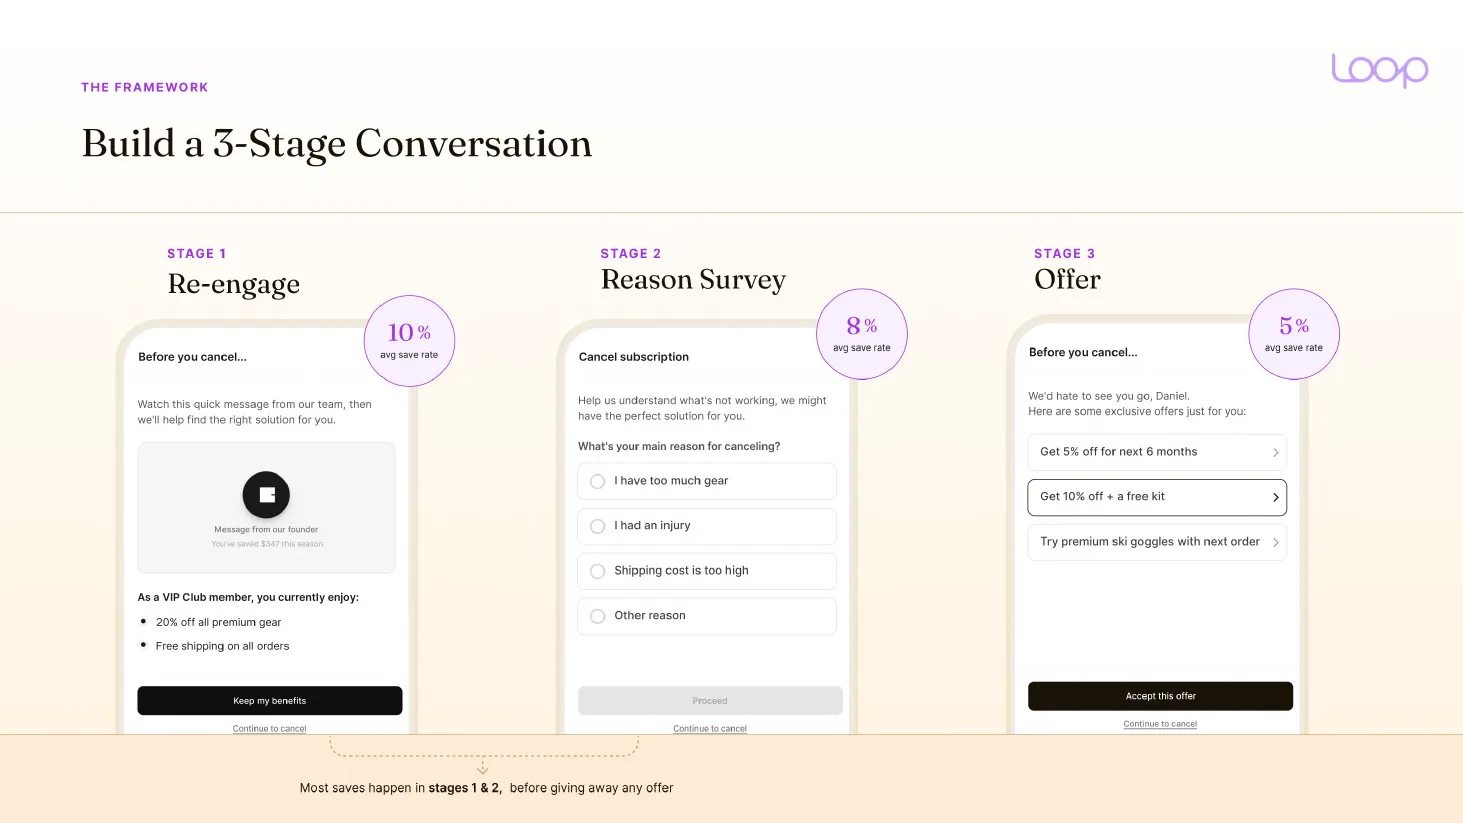
And size it. Loop says to wait for 100+ cancel attempts per variant. At a 20% save rate, seeing a lift to 25% takes about 1,090 per arm.
Then judge saves by what happens after the save. One of our brands on Skio saved more people with contact support than with any other treatment, and earned the least per save afterward. Sample sizes and the order to test in are in how to A/B test a subscription program.
RFM: scoring who your best buyers are
Customers are not created equal. RFM scores every customer on Recency, Frequency and Monetary together, then rolls the scores into 8 to 10 segments you can act on.
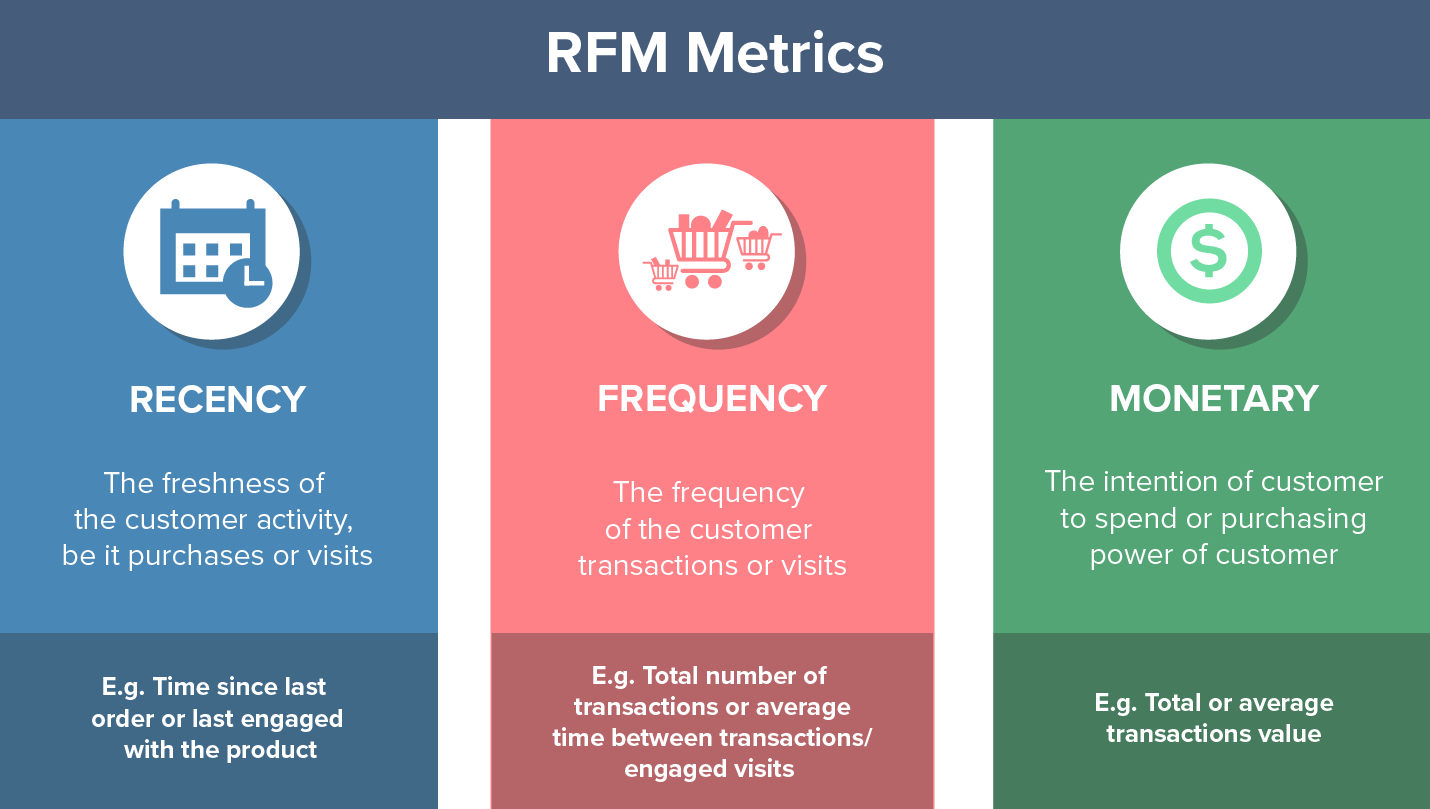
In Excel, use a 3x3x3 scale. That is 27 segments instead of the 125 a 5x5x5 grid creates. Run it on 2 years of data at most.
One warning for subscription brands. "Frequency" in your subscription app means the delivery interval. In RFM it means order count. And RFM groups behavior. It does not reveal desire. I've seen brands build 20+ segments, then send the same campaign to all of them. The Excel steps and six everyday segments are in RFM analysis for subscription brands.
Getting the numbers read on your own store
If you are deciding who should run this for you, see what subscription retention experts do and what a subscription retention agency costs.
Most of these numbers come out of one export. And the first read is usually where a brand finds out its take rate was inflated or its active count too high. The Subscription LTV Roadmap™ is that read of your subscription data, then a 90-day plan of 30 to 50 changes in order, in 3 working days, for $1,000. For a quicker look, the free subscription audit checks 48 points and names your top 3 leaks in 24 hours.
FAQ
What are the most important subscription metrics to track?
Order 3 retention, take rate and 12-month LTV are the three we track first. Order 3 retention shows whether subscribers stay past the early orders where most churn happens. Take rate shows how many buyers choose subscription at all. 12-month LTV is the gross profit a cohort actually paid you. Around them, watch active and passive churn separately, CAC payback, cancel flow save rate and payment recovery, each counted on a written definition.
What is a good retention rate for a subscription business?
For supplements on a monthly plan, we rate order 3 retention under 45% as poor, 45 to 62% as average, 62 to 72% as good and over 72% as excellent. Recharge data on about 1,750 supplement brands puts the average at 49.1% at order 3. Those are our bands, not an industry standard, so check the definition behind any number before you compare yours with it.
How do you calculate LTV for a subscription brand?
Take one monthly cohort of new subscribers, count the share that paid each order, multiply each share by gross profit per order, and add it up to order 12. That gives 12-month LTV per starting subscriber, built only from money that already arrived. The simple formula, gross profit divided by monthly churn, often comes out twice as high as what the cohort really paid.
What is the difference between active and passive churn?
Active churn is a subscriber choosing to cancel. Passive churn is a payment that fails and never recovers, so nobody decided to leave. Paddle and ProfitWell put passive churn at 20 to 40% of total churn, but your own split can sit far outside that range. Split the two before you fix anything, because a dunning fix does nothing for a brand whose churn is almost all active.
What is a good LTV to CAC ratio?
A good LTV to CAC ratio for a subscription brand is 3:1 to 4:1, counted on 12-month gross profit. Count LTV from cohorts, not from the simple churn formula, or the ratio flatters you. A 3:1 on lifetime numbers can be 1.4:1 over the first 12 months for the same subscriber. So read the ratio next to CAC payback, never on its own.
What is a good CAC payback period for subscriptions?
Aim to recover CAC by order 2. On monthly billing that is inside 31 days, and on quarterly billing inside 91 days. Most subscription brands sit between day 60 and day 90. Past 90 days you are funding acquisition from savings or a credit line. A 3-month supply can pay CAC back on day one, which is why prepaid plans shorten payback so much.
One email a week on subscription retention: the numbers, the strategy, and what to fix first.

Rahi Jain
Rahi Jain is a subscription LTV specialist who helps $1M to $10M DTC brands reduce subscription churn and maximize LTV on Recharge, Skio, Stay AI and Loop.
More about Rahi