Key takeaways
- At one brand, most cancellations fell on three days: the signup day, the pre-charge reminder day and the charge day.
- Day 30 held 9.11% of every monthly cancellation, the biggest single day. Every frequency peaked on its own charge date.
- Day 27, the reminder, held 3.73% of monthly cancels against 1.02% and 1.57% either side. A spike with two quiet days around it is a send.
I pulled every cancelled subscription from one brand. Every single one they have ever had.
Instead of counting cancellations by month, I counted them by day. Cancelled date minus start date.
Most cancellations happen on three days. And none of the three is about the product.
This is the subscription churn analysis I run first on every audit. So this page is the diagnosis: how to build the chart, how to read each spike, and the one number for the reminder. It sits in the subscription metrics guide, so each fix gets one line here.

How to build a cancellation day chart
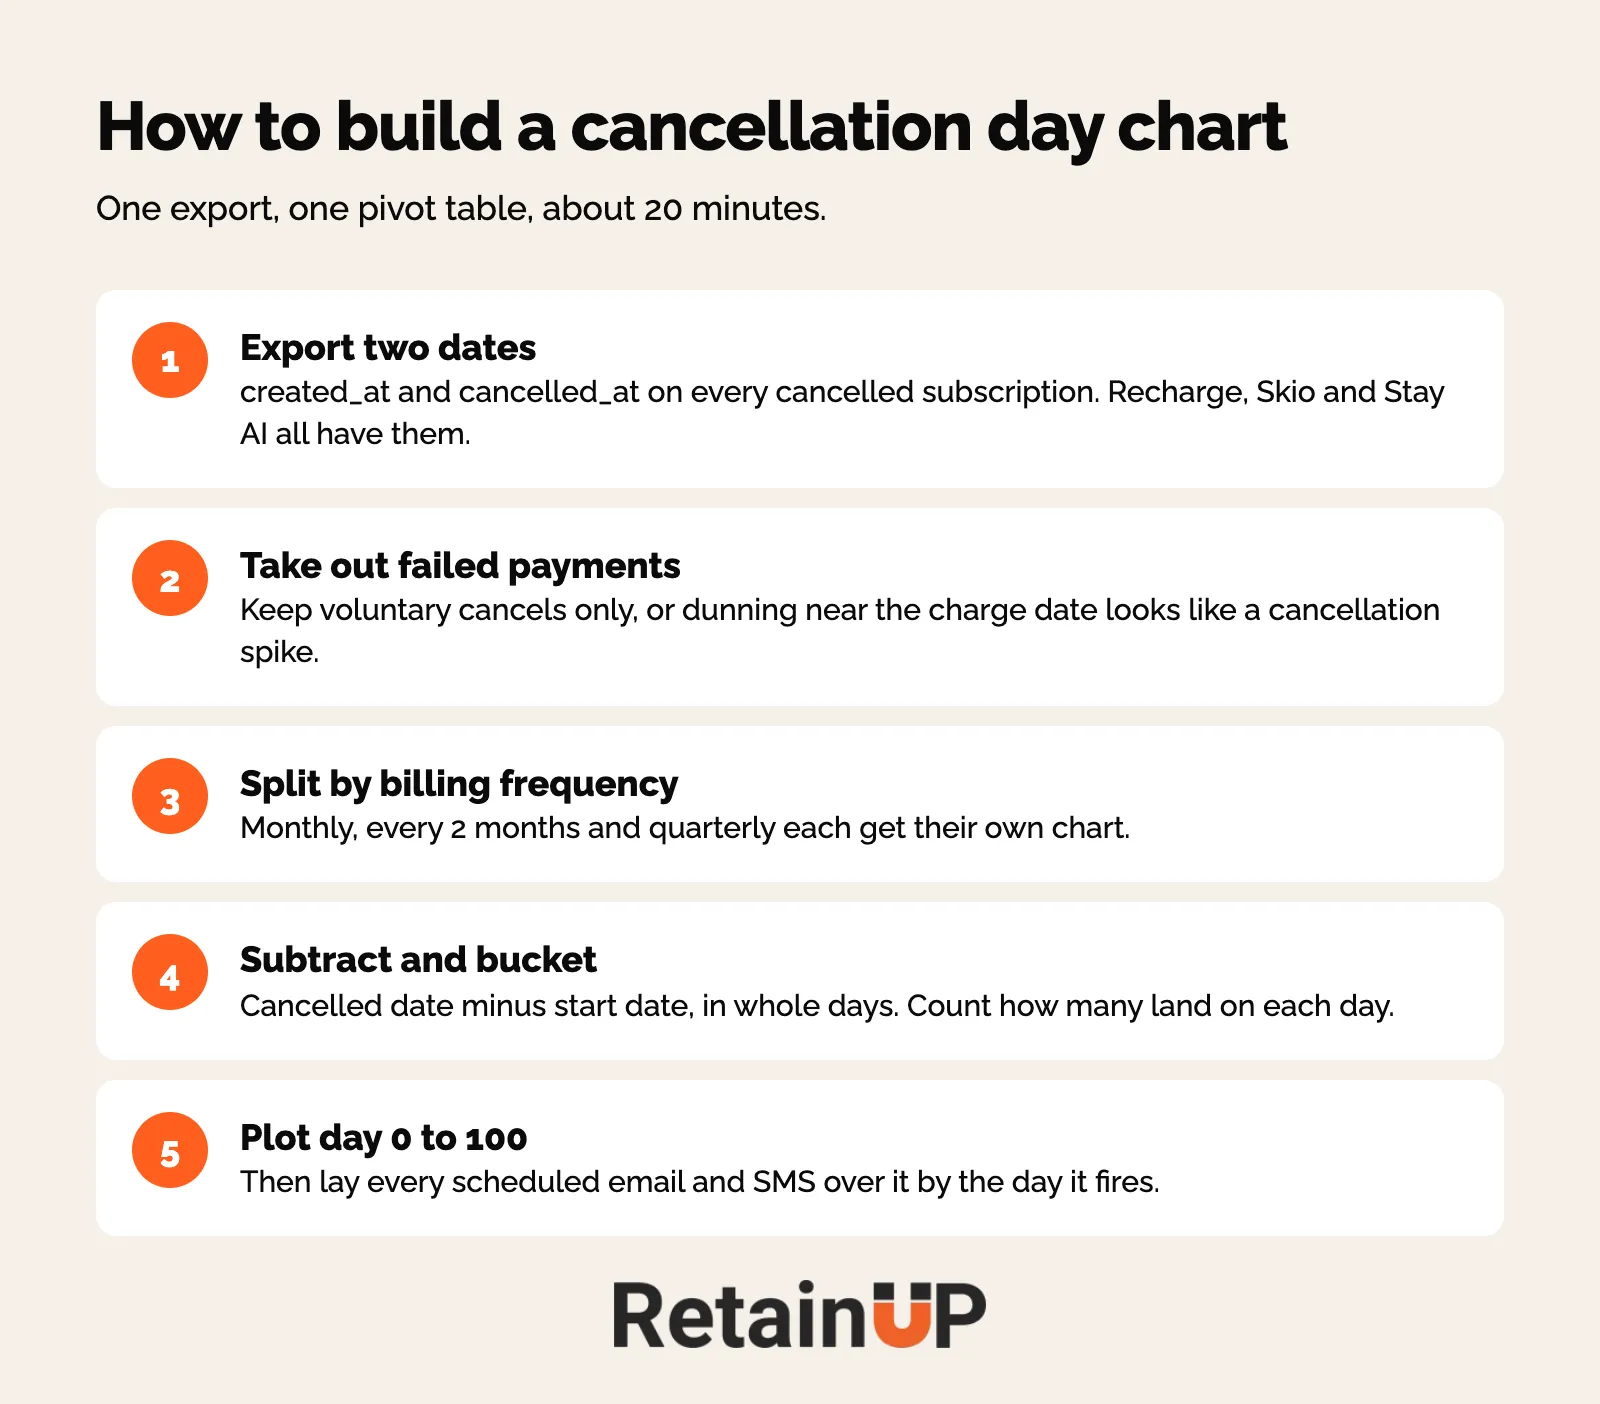
For every cancelled subscription, take the cancellation timestamp minus the creation timestamp, in days. Bucket by day. Plot day 0 to day 90, or day 0 to 100 if you run quarterly plans.
Recharge, Skio and Stay AI all export created_at and cancelled_at on the subscription. One export, one pivot table. About 20 minutes.
Your app may already show a rough version. Skio's cohort dashboard buckets churn events into same day, before renewal and after 1, 3 and 6 months. Loop's cancellation analytics reports 0-day churn and cancels after the next-order notice. Good for a first look. But a bucket hides the day. And the spike is the day.
In a spreadsheet
- Export cancelled subscriptions with created_at, cancelled_at, the billing frequency and the cancel reason
- Add a column: cancelled_at minus created_at, rounded down to whole days
- Filter out cancels caused by failed payments
- Pivot: days as rows, billing frequency as columns, count of subscriptions as values
- Turn each column into a share of its own total, so a small frequency reads on the same scale as monthly
One thing before you run it. Split by billing frequency first.
If you chart monthly, two-monthly and quarterly subscribers together, the renewal spike spreads across three different days and none of them looks like a spike. You will conclude there is no pattern. There is. You just smeared it.
Why it beats the lapse point
The lapse point tells you which month subscribers leave. This chart tells you which moment, and each moment has a different cause.
Lapse point averages the structure away. If 20% of cancels land on day zero and 35% land on day 30, the average month is a blend of two unrelated behaviours and points at neither. So lapse point gives you one window to work in. The day chart gives you three.
It is also the better before-and-after picture. Churn moving from 8.8% to 7.9% is invisible on a slide. A day zero spike collapsing is not.
What every cancellation at one brand shows
- Day zero. They cancel the day they subscribe. 5.6% to 8.4%, at every frequency.
- The reminder. Three days before the charge, when the pre-charge email arrives. Day 27 for monthly subscribers, 3.73% of all monthly cancels.
- The charge. Day 30 for monthly. 9.11%, the biggest single day.
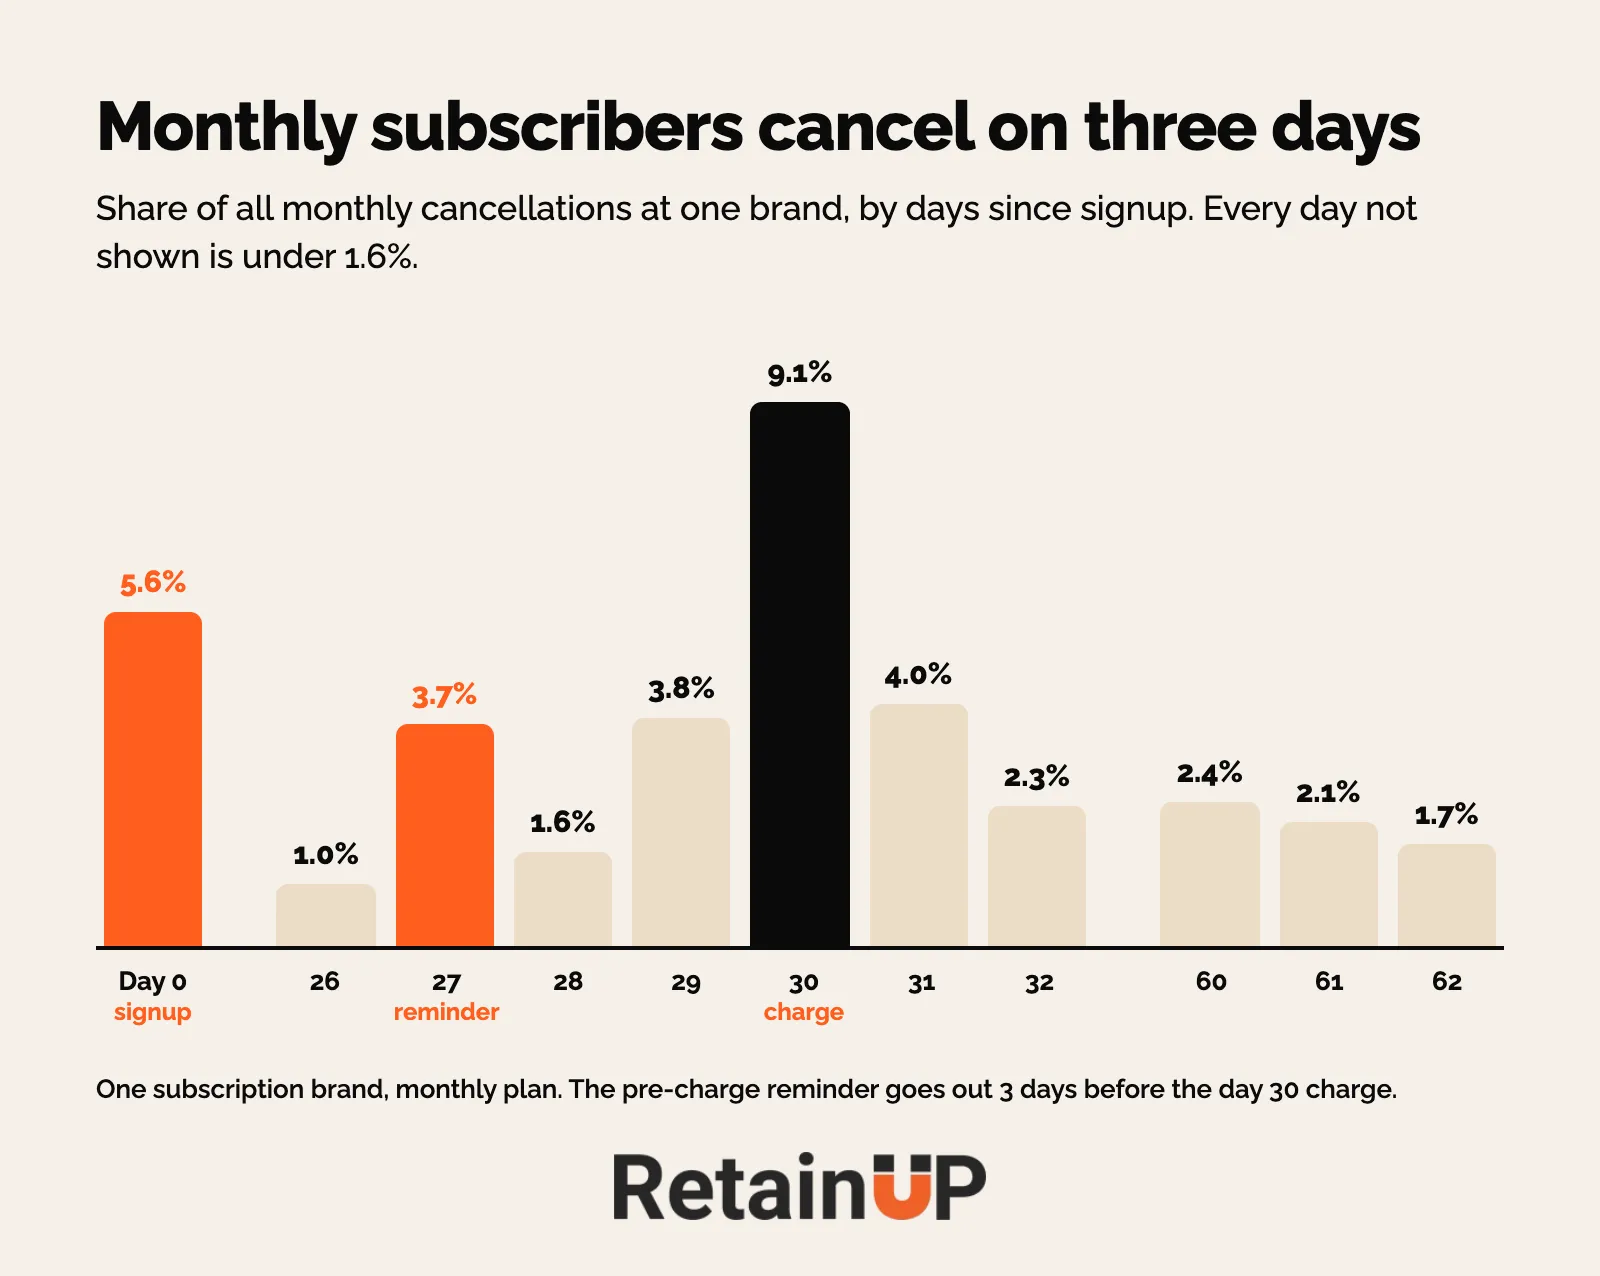
Every 1 month, with the charge on day 30
| Day | Share of monthly cancels |
|---|---|
| 0 | 5.60% |
| 26 | 1.02% |
| 27 | 3.73% |
| 28 | 1.57% |
| 29 | 3.81% |
| 30 | 9.11% |
| 31 | 4.04% |
| 32 | 2.33% |
| 60 | 2.42% |
| 61 | 2.06% |
| 62 | 1.69% |
Days 27 to 34 alone hold 27.1% of every monthly cancellation this brand has ever had. Inside one week.
Every 3 months, with the charge on day 91
| Day | Share of quarterly cancels |
|---|---|
| 0 | 7.36% |
| 86 | 1.58% |
| 88 | 3.82% |
| 89 | 3.99% |
| 90 | 5.04% |
| 91 | 8.08% |
| 92 | 3.41% |
| 93 | 1.72% |
| 94 | 1.30% |
| 123 | 1.43% |
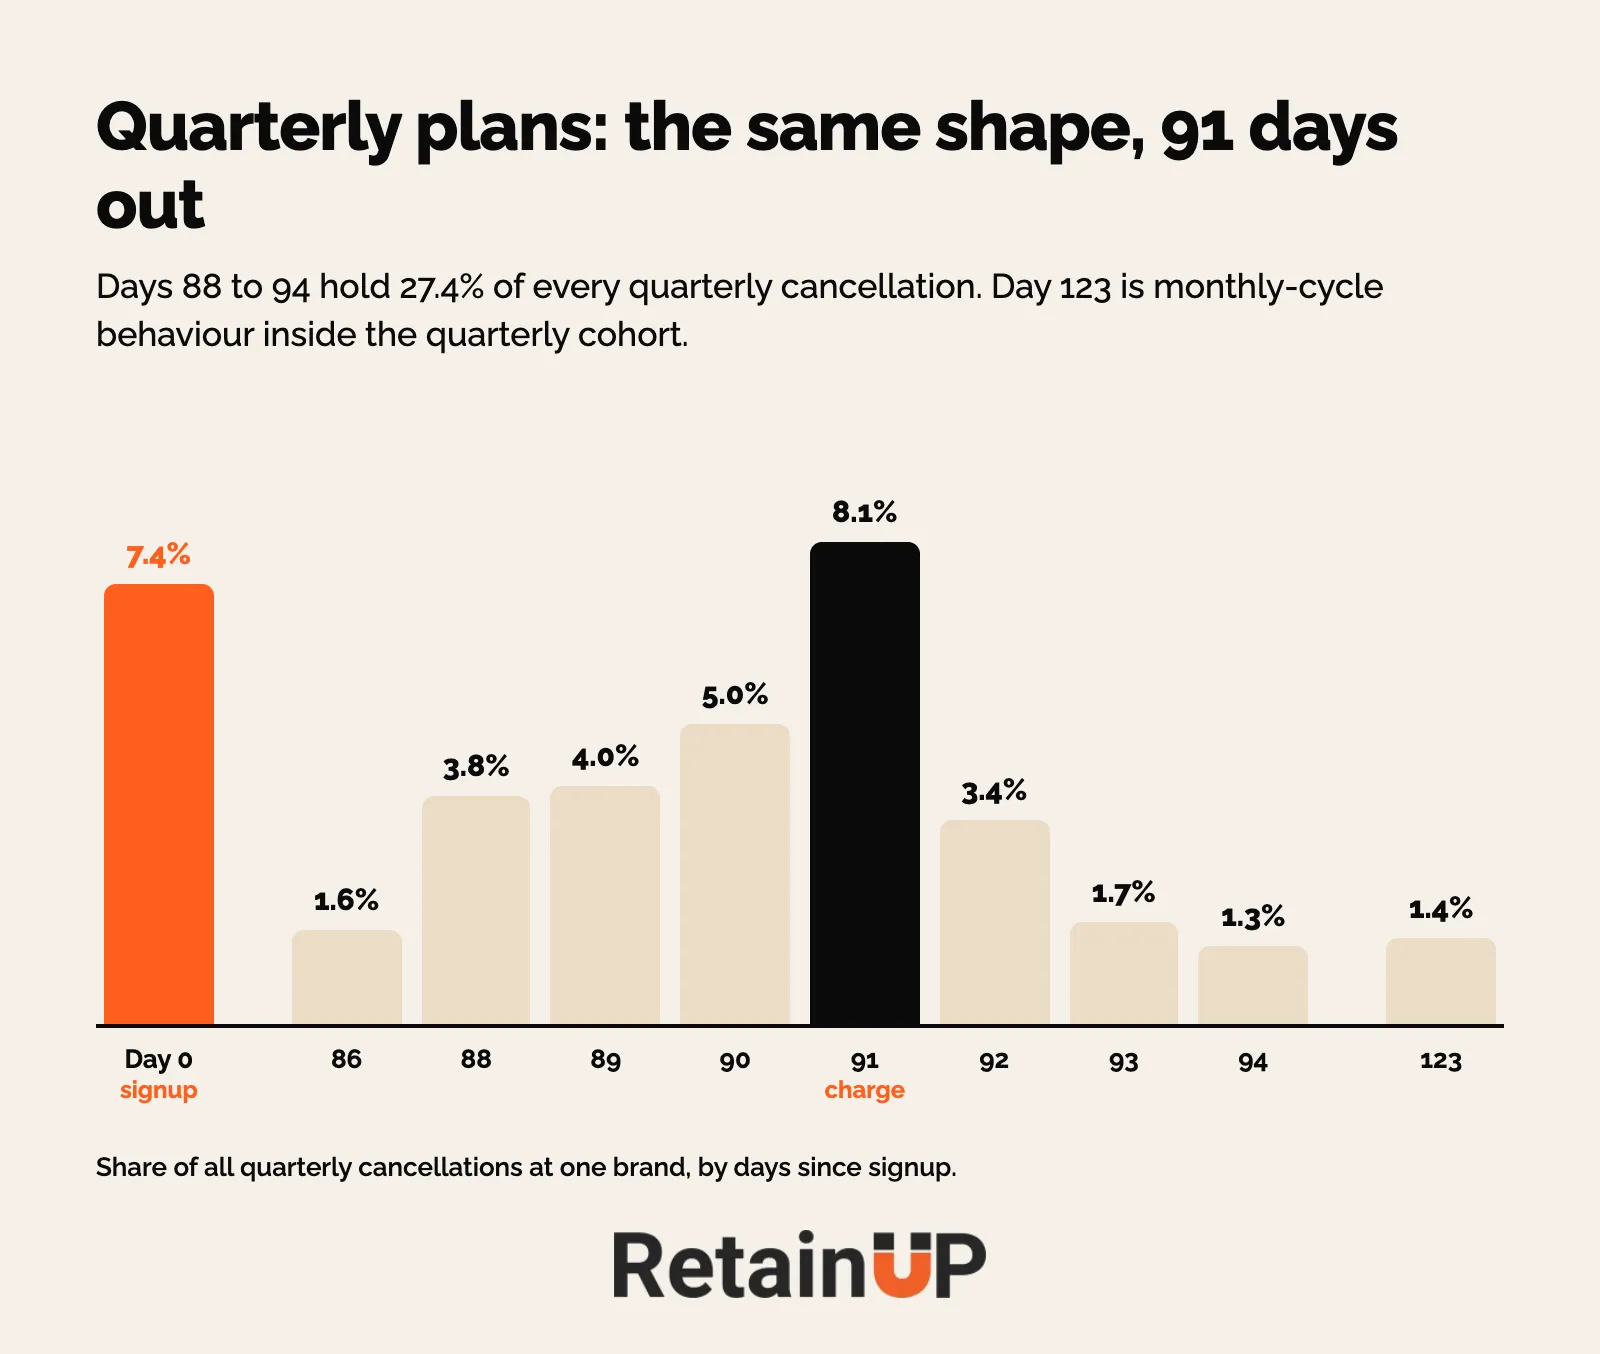
Days 88 to 94 hold 27.4%. Day 123 showing up is monthly-cycle behaviour inside the quarterly cohort, and worth a look on its own.
Read down the chart and the shape repeats. A spike on day zero. A ramp starting three days before the charge, the peak on the charge day, and a tail for two days after. Then it happens again at the second charge.
The biggest single day, per frequency
| Frequency | Peak day | Share of that frequency | Its charge day |
|---|---|---|---|
| Every 1 month | Day 30 | 9.11% | 30 |
| Every 2 months | Day 60 | 8.43% | 61 |
| Every 3 months | Day 91 | 8.08% | 91 |
| Every 3 weeks | Day 0 | 8.36% | 21 |
| Every 6 months | Day 181 | 8.39% | 183 |
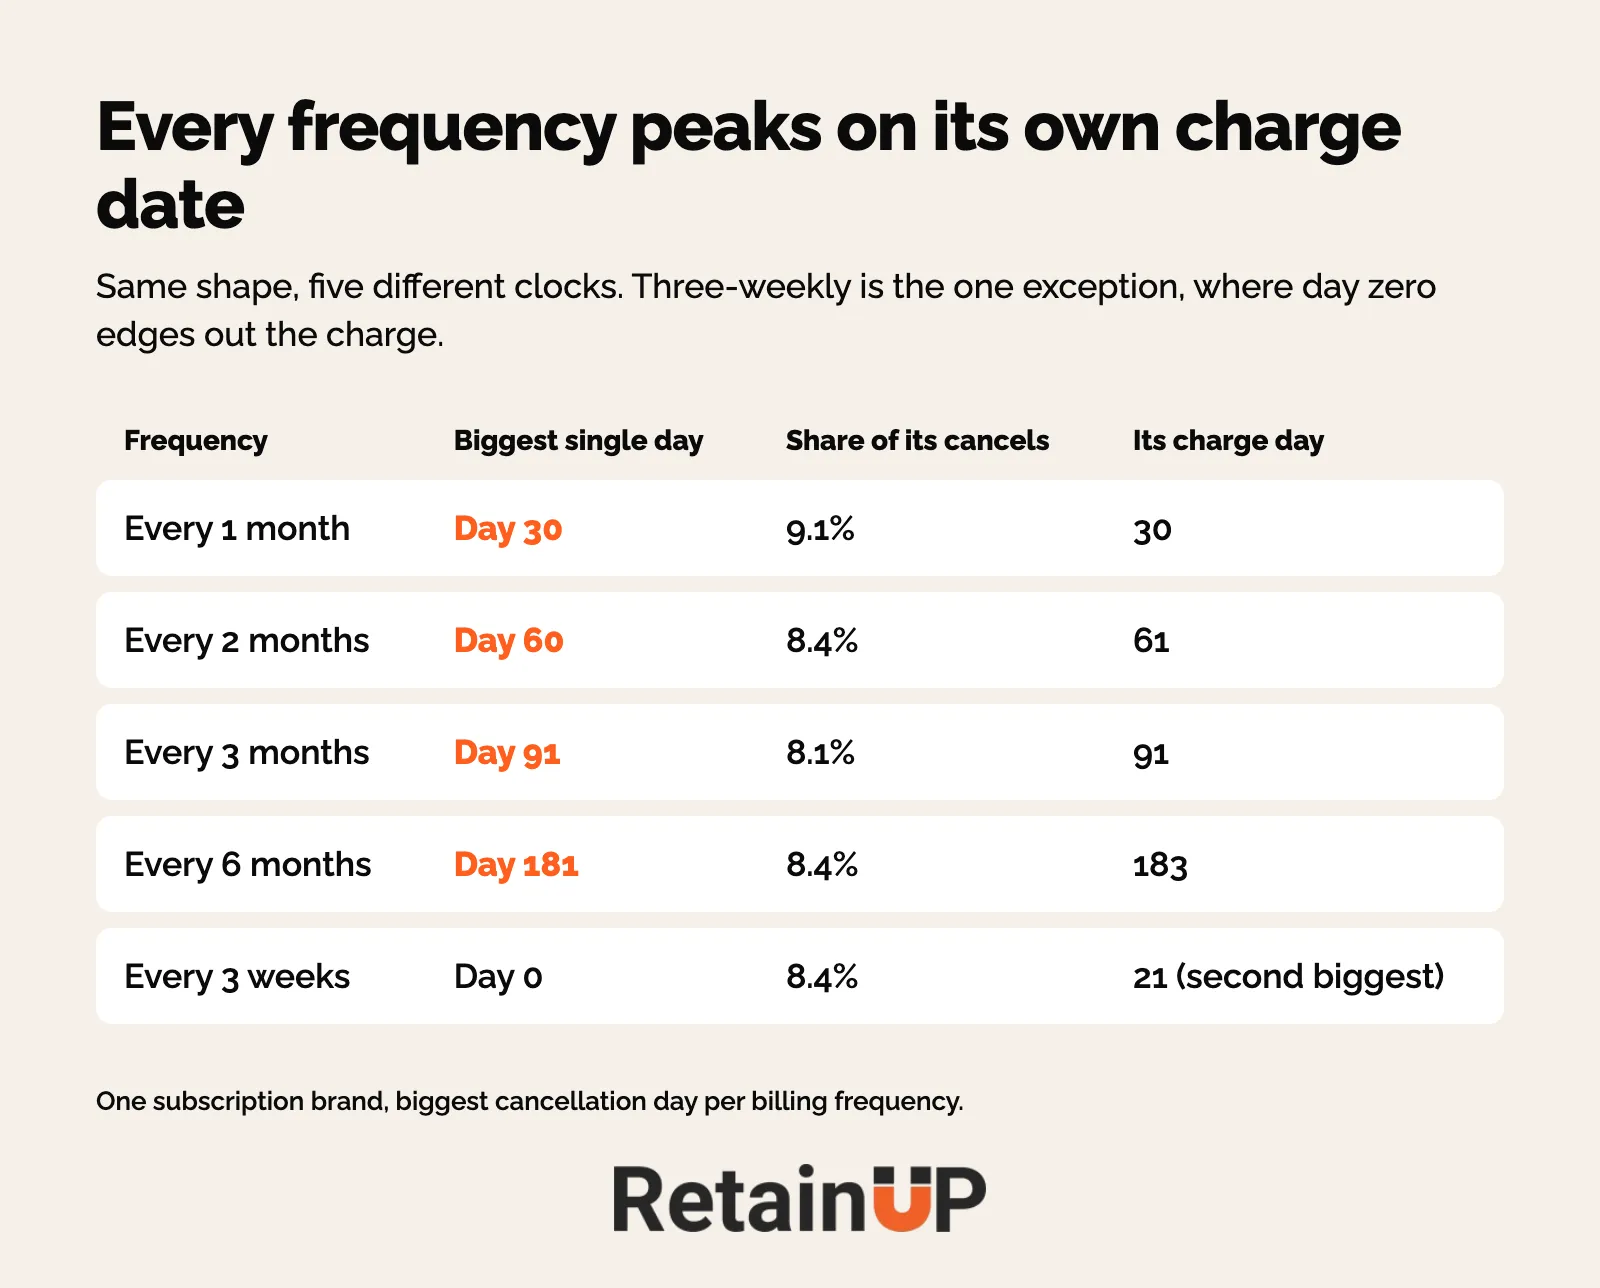
Every frequency with volume peaks on its own charge date, give or take a day. Three-weekly is the one exception. Its biggest day is day 0, with its charge day second at 7%, and the second and third charges show up cleanly at days 41 to 42 and 62.
Day zero: a spike that ignores billing
Day zero barely moves across frequencies. Monthly was 5.6%. Quarterly 7.4%, two-monthly 7.6%, three-weekly 8.4%.
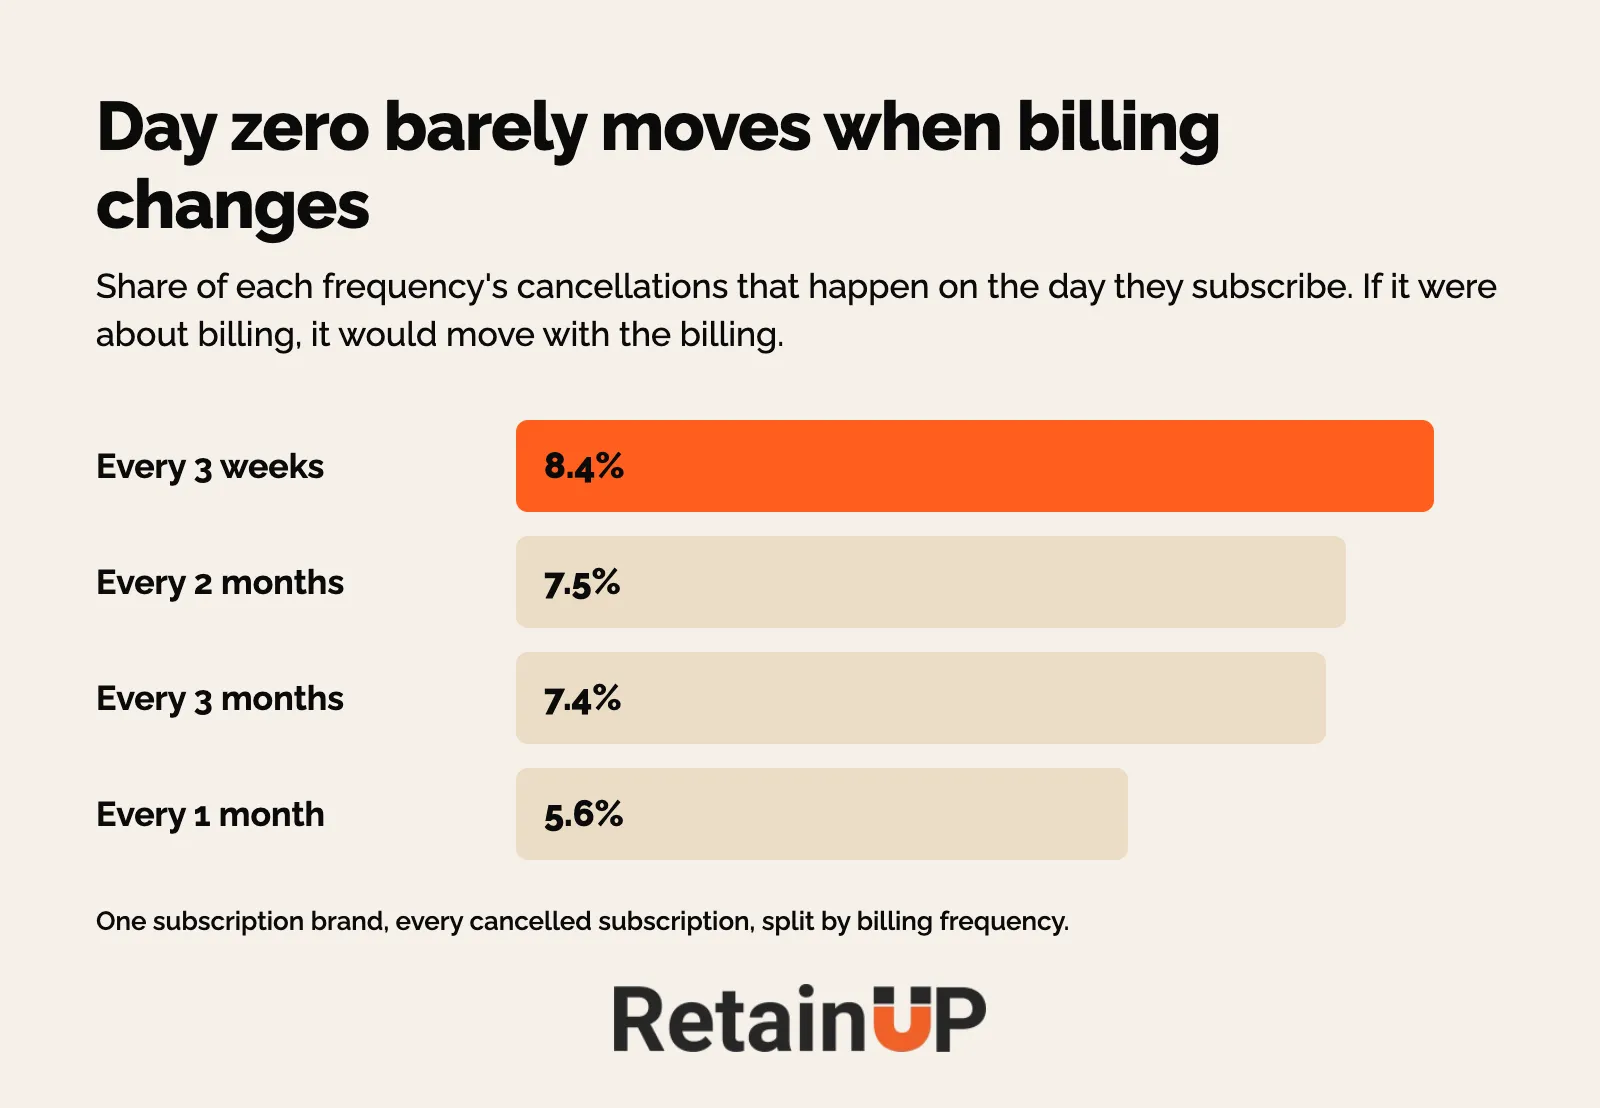
If day zero had anything to do with billing, it would change when the billing changes. It does not.
It is the offer. The first order is worth more on subscription than paying once, so people subscribe, take the discount and the gift, and leave the same day. Your customer did the maths correctly.
A second brand sees the same shape. Nick Shackelford of Brez put it as three peaks: day 1, day 28 with the billing reminder, and a strange 31 to 45 day window. His read on day 1 matches mine. Those people bought for the discount.
And day zero is not always a number to push down. A founder sent me this: they took the free gift and cancelled the same day. He wanted to pull the offer back. We told him not to.
One brand we work with is about to double their day zero cancellations, on purpose. They sit at 7 to 8% inside 30 days, and after the new offer we expect about 15%, with take rate going from 20% to 70%. Losing more people at the start of a much bigger pool is still a better business. So the number to watch is how many are still there at order 3.
Read day zero as the price of your offer. The checkout and first-order fixes are in how to stop day zero cancellations.
Reminder day: spikes caused by your own sends
Look at day 27 in the monthly table. 3.73%, more than three times the day before and more than twice the day after.
Behaviour does not do that. Behaviour is smooth.
A spike with two quiet days around it is a send. Day 27 is when this brand emails you three days before your charge. The brand added that email so nobody would be surprised by the charge. It worked. It also created a cancellation day.
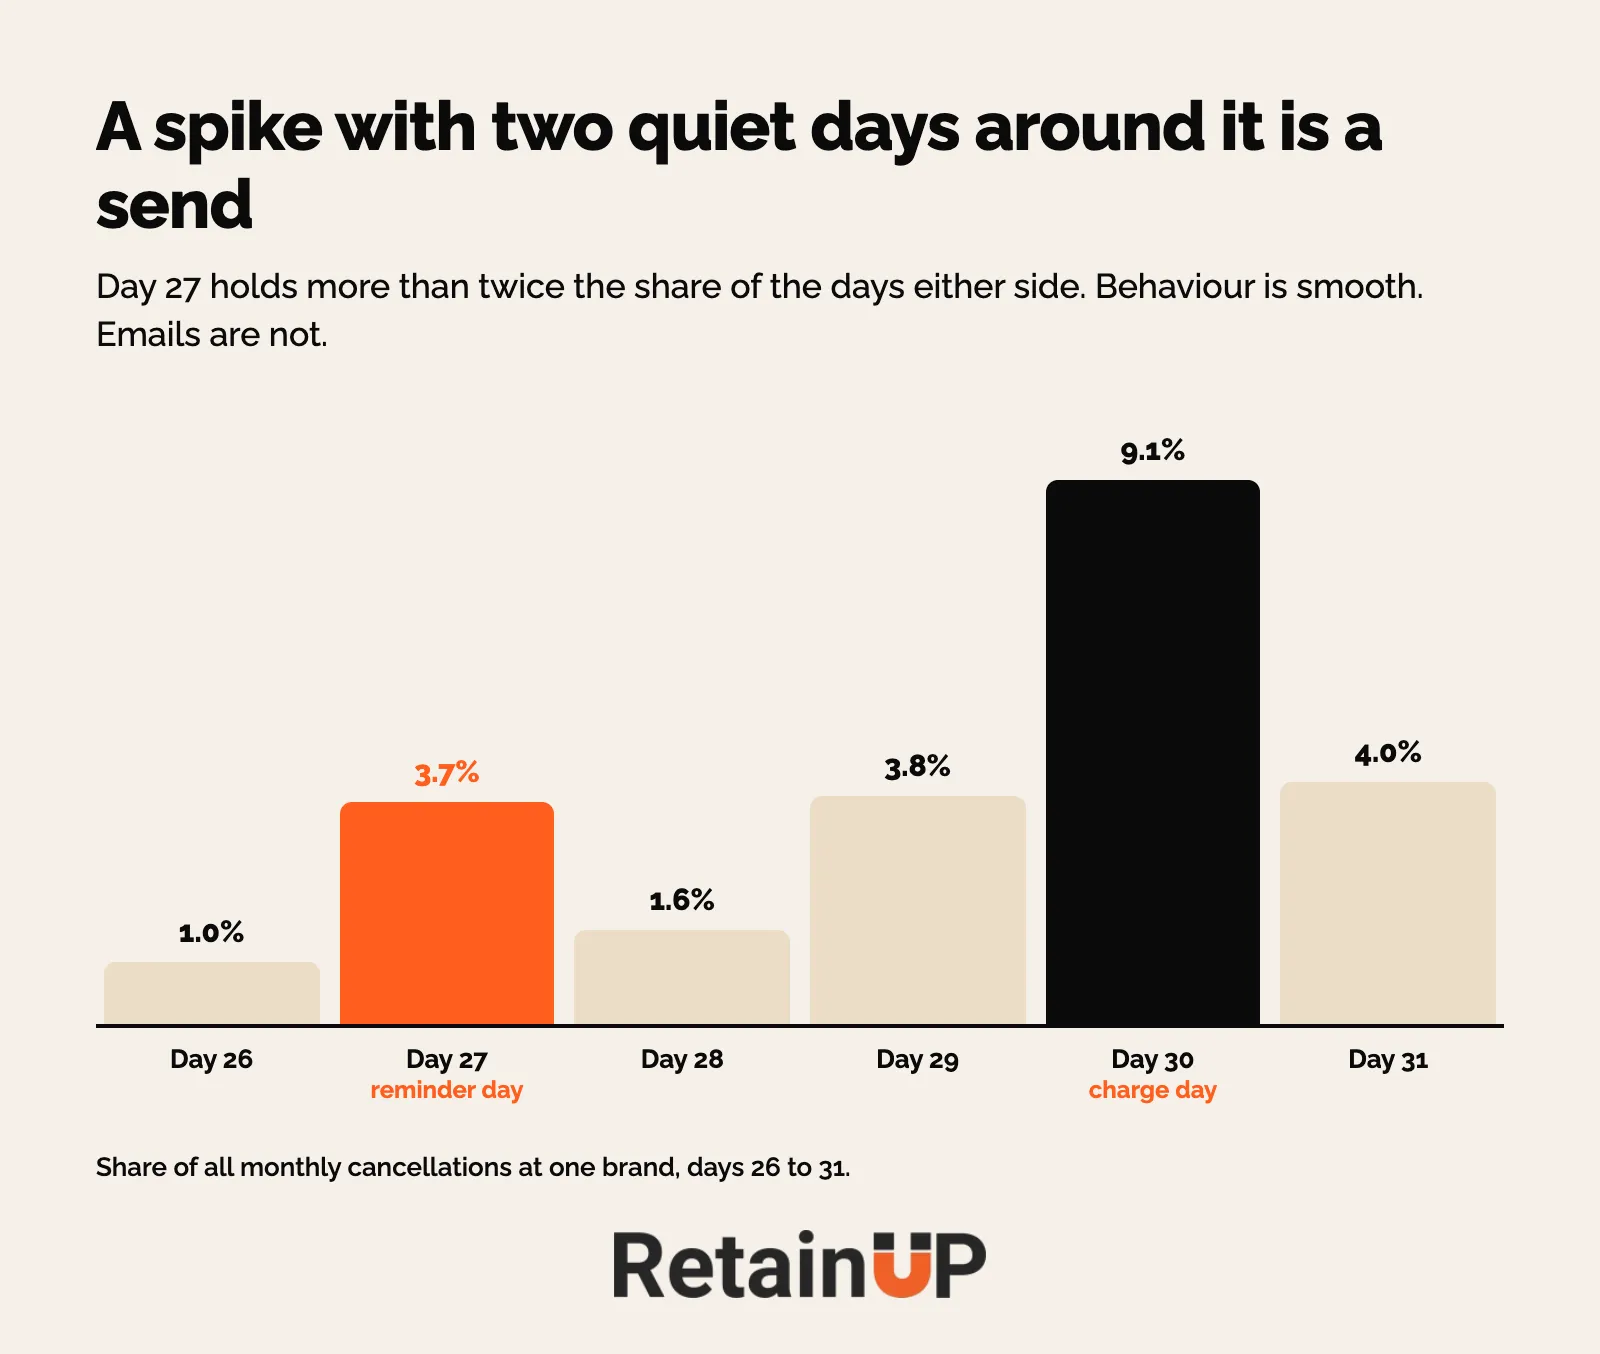
How to find your own send spikes
Lay every scheduled email and SMS over the chart by the day it fires relative to signup. The upcoming charge reminder, the shipping notice, any loyalty or points email. Then look for a single bar that stands above both neighbours.
Most brands assume the reminder lives in Klaviyo. Very often it is sent by Recharge, Skio or Stay AI, and nobody has looked at it since the app was installed. So check both before you name the cause.
Do not delete the email because of the spike. You send the reminder so nobody is surprised, and the reminder is the cancellation trigger. Most brands never test whether it is net positive. What it should say is in the upcoming billing reminder.
Charge day: the biggest spike on the chart
Every frequency peaks on its own charge date. Monthly on 30, two-monthly on 60, quarterly on 91, six-monthly on 181.
Same shape, five different clocks. Nobody woke up on day 91 and stopped liking the product. The card got charged.
Most of these people are surprised. They had lost track of the subscription, and the charge reminded them. They cancelled within minutes.
Thomas Lalas calls these accidental renewals. Ghosting subscribers does not protect you from cancellations. It creates angry customers who lost track of the subscription, get charged, cancel, and follow up with refunds, chargebacks and bad reviews.
Max Sturtevant sees billing day run 50 to 100% higher than reminder day, and our data agrees: 9.11% of monthly cancels on day 30 against 3.73% on day 27. So what people are told at signup matters more than how polished the reminder is.
The spike gets smaller each renewal
On the monthly chart, the second charge on day 60 holds 2.42%, about a quarter of day 30. Recharge sees the same thing across its brands. In its churn data from July 2025 to March 2026, about 61% of voluntary cancels happened at the first two renewals and about 72% within the first four. That is across their brands, so check your own.
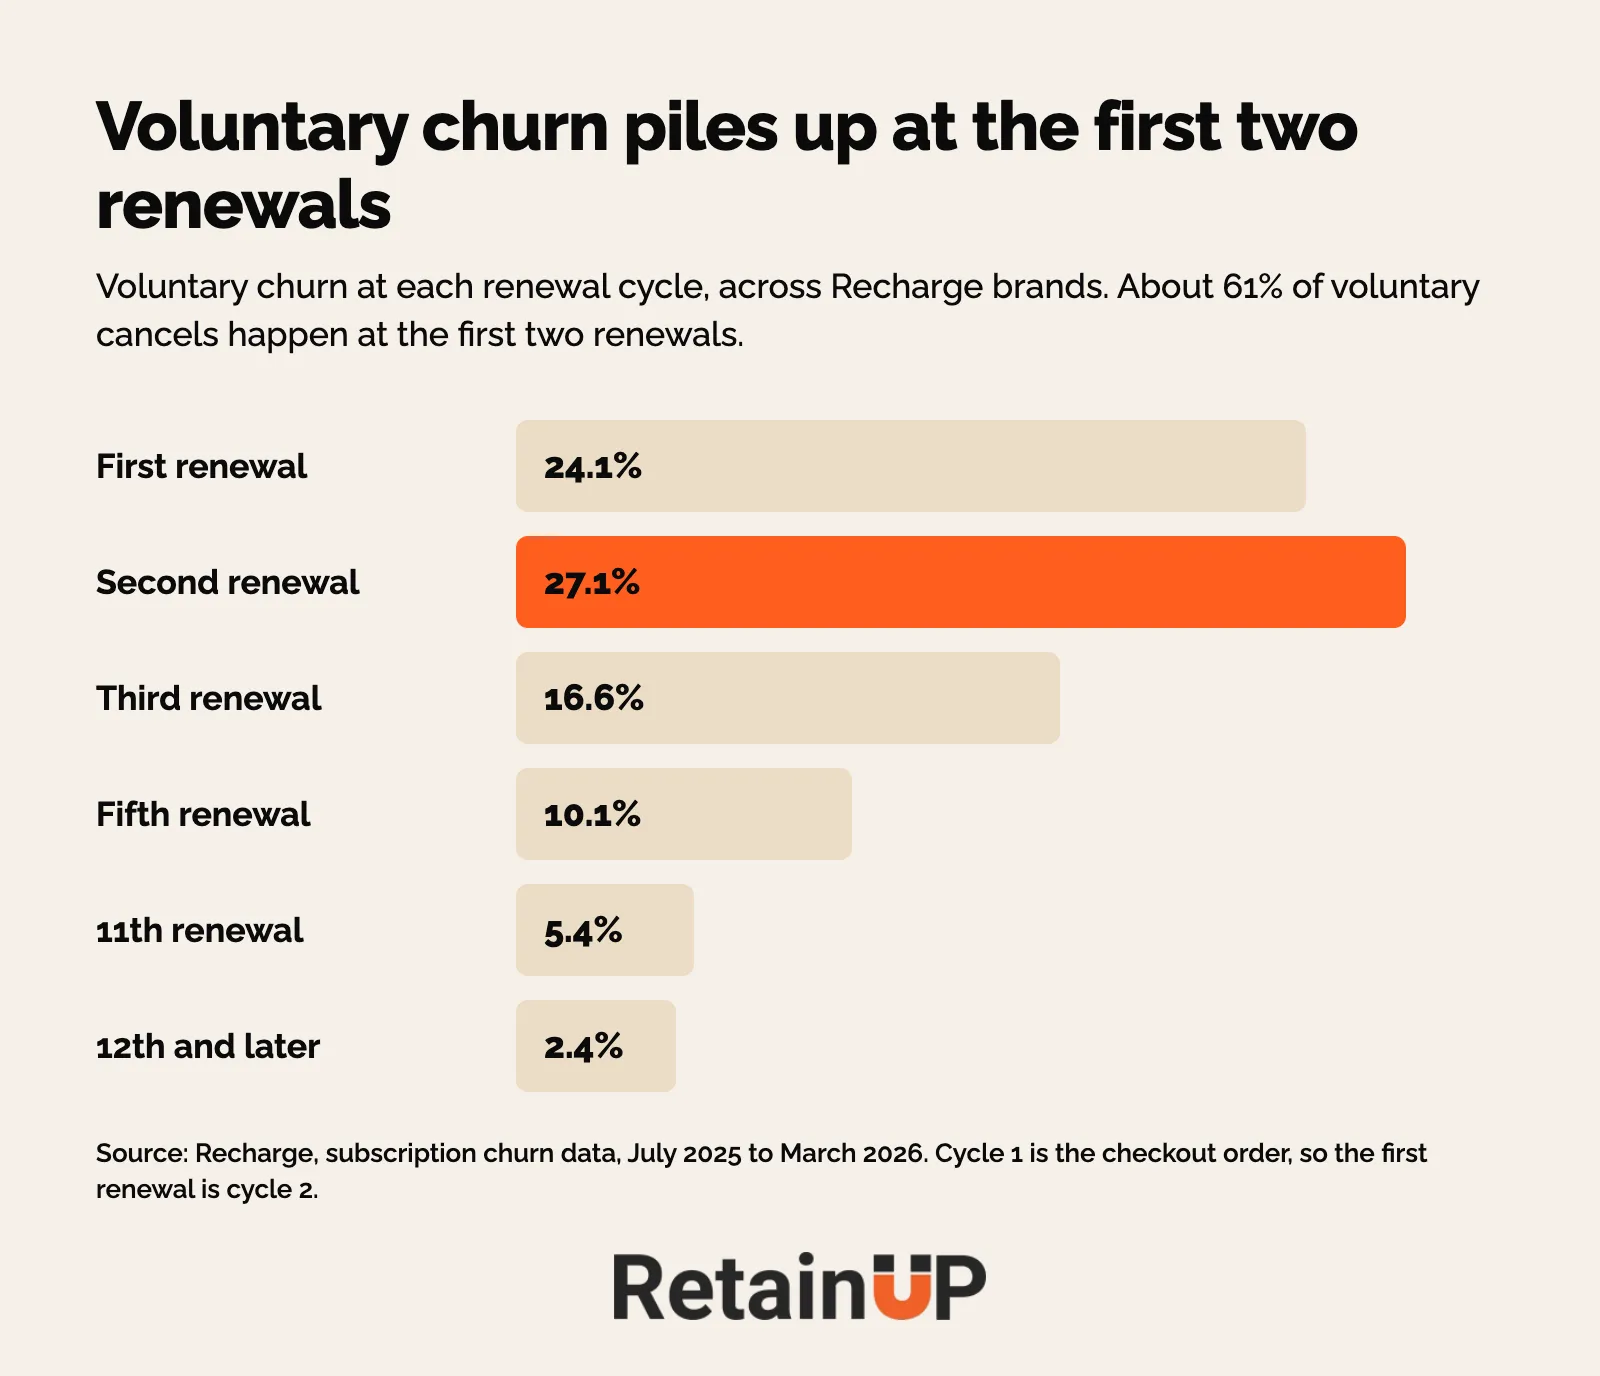
So the first two charge days carry most of the risk. For the order-by-order view, use churn by order number.
The trade the chart lets you price
Pre-selecting subscription and pushing one-time out of the widget lifts take rate. It also inflates this spike. The day chart is how you price that trade, next to your take rate.
And when disclosure gets fixed properly, expect day zero to go up. People who would have been surprised on day 30 decide on day 0 instead, before you have paid to ship anything.
The pre-rebill cancel rate
Day 27 looks bad on its own. So do not measure the reminder by staring at day 27.
Measure the full seven-day window around renewal, with the reminder and without it, because the email creates a cancellation day and prevents a different one. What matters is the whole week.
Then track one number for the reminder, which Max Sturtevant shared in November 2026.
| Metric | Formula | How to chart it |
|---|---|---|
| Pre-rebill cancel rate | Subscriptions cancelled in the 3 days before a scheduled rebill ÷ rebills due that day | Bars for rebills due per scheduled day, a line for the rate |
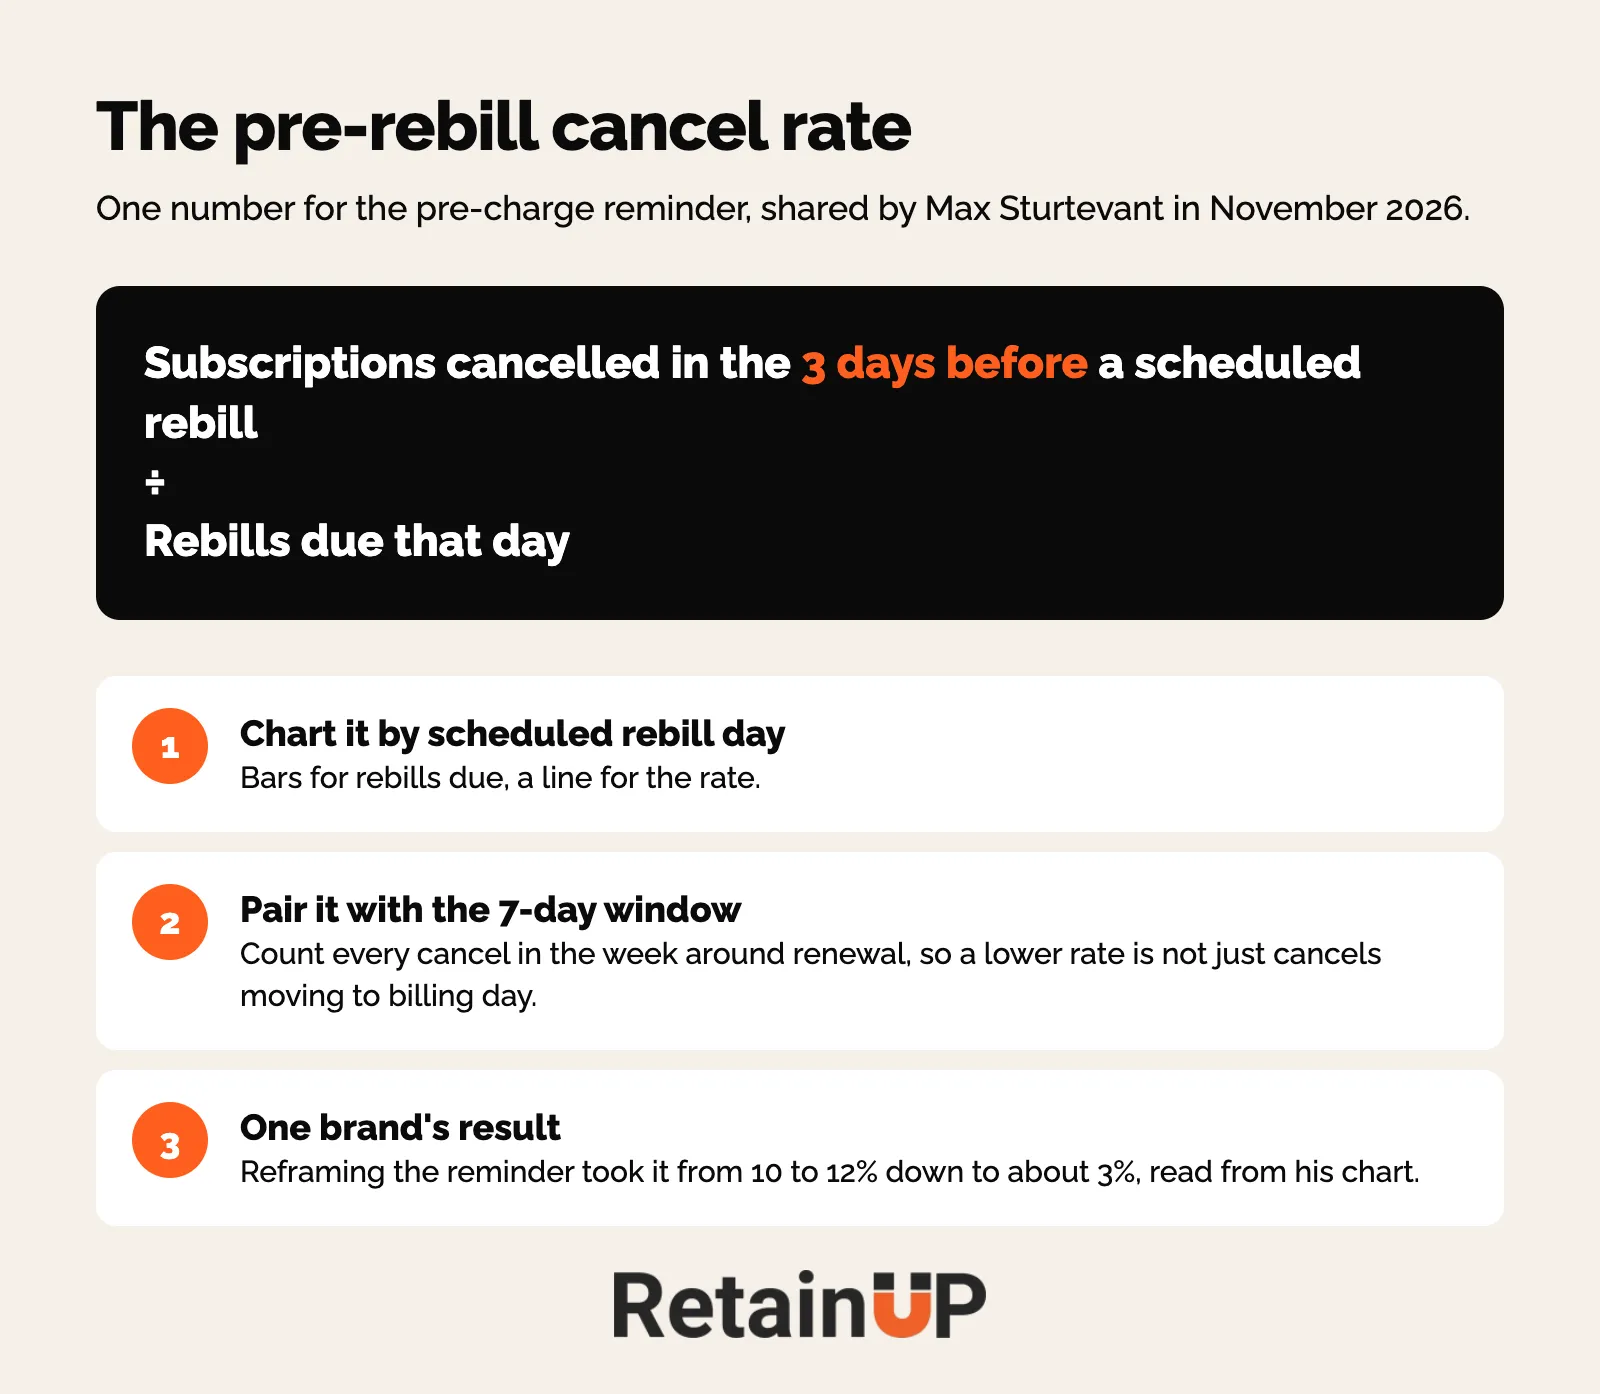
His client averaged 7.46%. Reframing the reminder took it from 10 to 12% down to about 3%, read from his chart, so treat it as one brand and not a benchmark.
Pair it with the seven-day window. A lower pre-rebill rate means little if the same cancels just moved to billing day.
And give any change two full billing cycles before you judge it. Skio gives the same advice in its guide to first-month cancellations, and on a monthly plan that is about 60 days.
Three ways to read the chart wrong
Mixed cadences smear the renewal spike. A brand running 30, 60 and 90 day plans spreads one behaviour across three days. Run the chart per frequency, or switch the x-axis to days relative to the next charge so every cadence lands on the same scale.
Passive churn contaminates charge day. Failed payments resolve near the charge date too. If your export mixes voluntary cancels with dunning exhaust, you will see a mountain on day 30 and conclude you have a cancellation problem when you have a card problem. Split out passive churn first. They have completely different fixes.
The wrong cancel date. The click, the status change and the end of the paid period can sit weeks apart, as Polar Analytics points out. Use the click. Leave skips and pauses out. A skip is not a cancel.
Two more spikes worth plotting
- Delivery day plus two or three. The product did not match what they expected
- The second renewal. The real did-it-work signal, once you have the volume to read it
- Restarts, plotted the same way. Sends move people back in too: Email Kong saw Ritual Labs' cancelled subscribers restart at about nine times the normal daily rate in the days around each win-back send
What the three days tell you
All three are expectation problems.
Day zero is what you promised at checkout. Day 27 is what your email said, and day 30 is what they did not know was coming.
| Spike | What it points at | Where the fix lives |
|---|---|---|
| Day 0 | The gap between the first subscription order and the one-time price | Day zero cancellations |
| Reminder day | What the pre-charge email says and which button is biggest | The upcoming billing reminder |
| Charge day | What they were told at checkout, on the thank-you page and in the order confirmation | The order confirmation email |
Which is also the limit of it. These are tactics. If people do not like what they bought, fixing all three moves nothing. Onboarding, how the product gets used, gifting, and whether they felt the benefit are what carry someone past order three.
What these three days give you is timing. They are the trigger points. What you say around them counts for more than everything you say in the weeks between, and most brands have never looked at them.
The video below builds the day zero fix in Recharge, Skio and Loop.

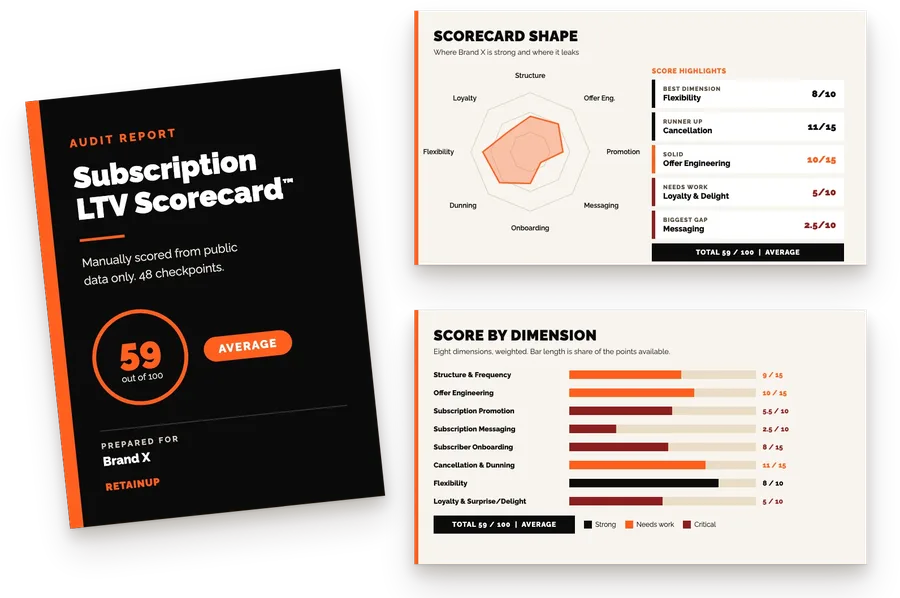
Plotting this chart is the first thing I do on every audit, and it is part of the Subscription LTV Roadmap™: a read of your subscription data, then a 90-day plan of 30 to 50 changes in order, in 3 working days, for $1,000. If you want a quicker look first, the free subscription audit checks 48 points and names your top 3 leaks in 24 hours.
FAQ
What day do most subscribers cancel?
Most subscribers cancel on one of three days: the day they subscribe, the day the pre-charge reminder lands, and the charge day. At one brand, day 30 held 9.11% of every monthly cancellation, the biggest single day. Day 27, the reminder, held 3.73%. That is one brand, so pull your own export before you plan around it.
How do you do a subscription churn analysis by day?
Take each cancelled subscription's cancelled date minus its start date, in days, and count how many land on each day. Recharge, Skio and Stay AI all export created_at and cancelled_at. One export, one pivot table. Run each billing frequency on its own, and split failed payments out first, or dunning near the charge date will look like cancellations.
Do pre-charge reminder emails cause cancellations?
Yes, a pre-charge reminder creates a cancellation day of its own. At one brand, day 27 held 3.73% of monthly cancels against 1.02% on day 26 and 1.57% on day 28. It also prevents surprise cancels on the charge day, which was still more than twice as big. So judge it on the full seven-day window around renewal, not on the day it fires.
What is the pre-rebill cancel rate?
It is the share of subscriptions due to rebill on a given day that cancelled in the three days before the charge. Divide those cancels by the rebills due that day. Chart it by scheduled rebill day, with bars for rebills due and a line for the rate. One brand Max Sturtevant worked with took it from 10 to 12% down to about 3% by reframing the reminder.
Why do subscribers cancel on the day they are charged?
Most are surprised. The charge is the first time they registered they were on a subscription. Every frequency at one brand peaked on its own charge date: day 30, 60, 91 and 181. And billing day can run 50 to 100% higher than reminder day, so what people are told at signup matters most.
One email a week on subscription retention: the numbers, the strategy, and what to fix first.

Rahi Jain
Rahi Jain is a subscription LTV specialist who helps $1M to $10M DTC brands reduce subscription churn and maximize LTV on Recharge, Skio, Stay AI and Loop.
More about Rahi