Key takeaways
- Order 3 retention is subscribers who paid order 3 divided by subscribers who paid order 1, same cohort. 236 of 400 is 59%.
- A weekly biller faces the stay-or-go decision 50 times a year and a quarterly biller 4, so monthly churn partly measures billing frequency.
- Churned's 2026 report puts churn at about 4.1 to 4.3% a month in December and January, against 3.2% in November.
This is one part of the subscription metrics guide, which walks every number a subscription brand should watch.
Say you open Shopify and it says your returning customer rate is 32%. Your subscription app says your 90-day retention is 61%. And then you read a blog that says 70 to 80% of supplement subscribers are gone before order 3.
So which one is right? And is yours any good?
All of them, kind of. Each one is a different formula, and each one hides something. This page goes through each formula, what it leaves out, the one we calculate for every client, and why your churn jumps every December.
In a hurry? Watch the breakdown.

The textbook retention rate formula, and why it breaks for subscriptions
First, what is retention rate. In simple words: of the customers who started, how many are still paying at a given point?
And every argument about retention is really an argument about that given point. One month, two months, twelve months, or the whole lifetime.
If you Google it, this is the formula you get. Pick a period, then take three numbers: customers at the start (S), customers at the end (E), and new customers added during the period (N).

Retention rate = ((E − N) ÷ S) × 100
That formula comes from businesses where customers sign a contract. Banks, telcos, insurance. Fine for SaaS. Weak for subscriptions. Two reasons.
- New subscribers land in the same period and hide the ones you lost. Have a big acquisition month and your retention looks great, even if half your old subscribers left.
- It runs on calendar time. Your subscribers don't decide on the 1st of the month. They decide on their order date, when the next charge is coming.
Churn rate is the same formula flipped. Instead of counting who stayed, you count who left.

Same two problems.
A worked example: one month, three answers
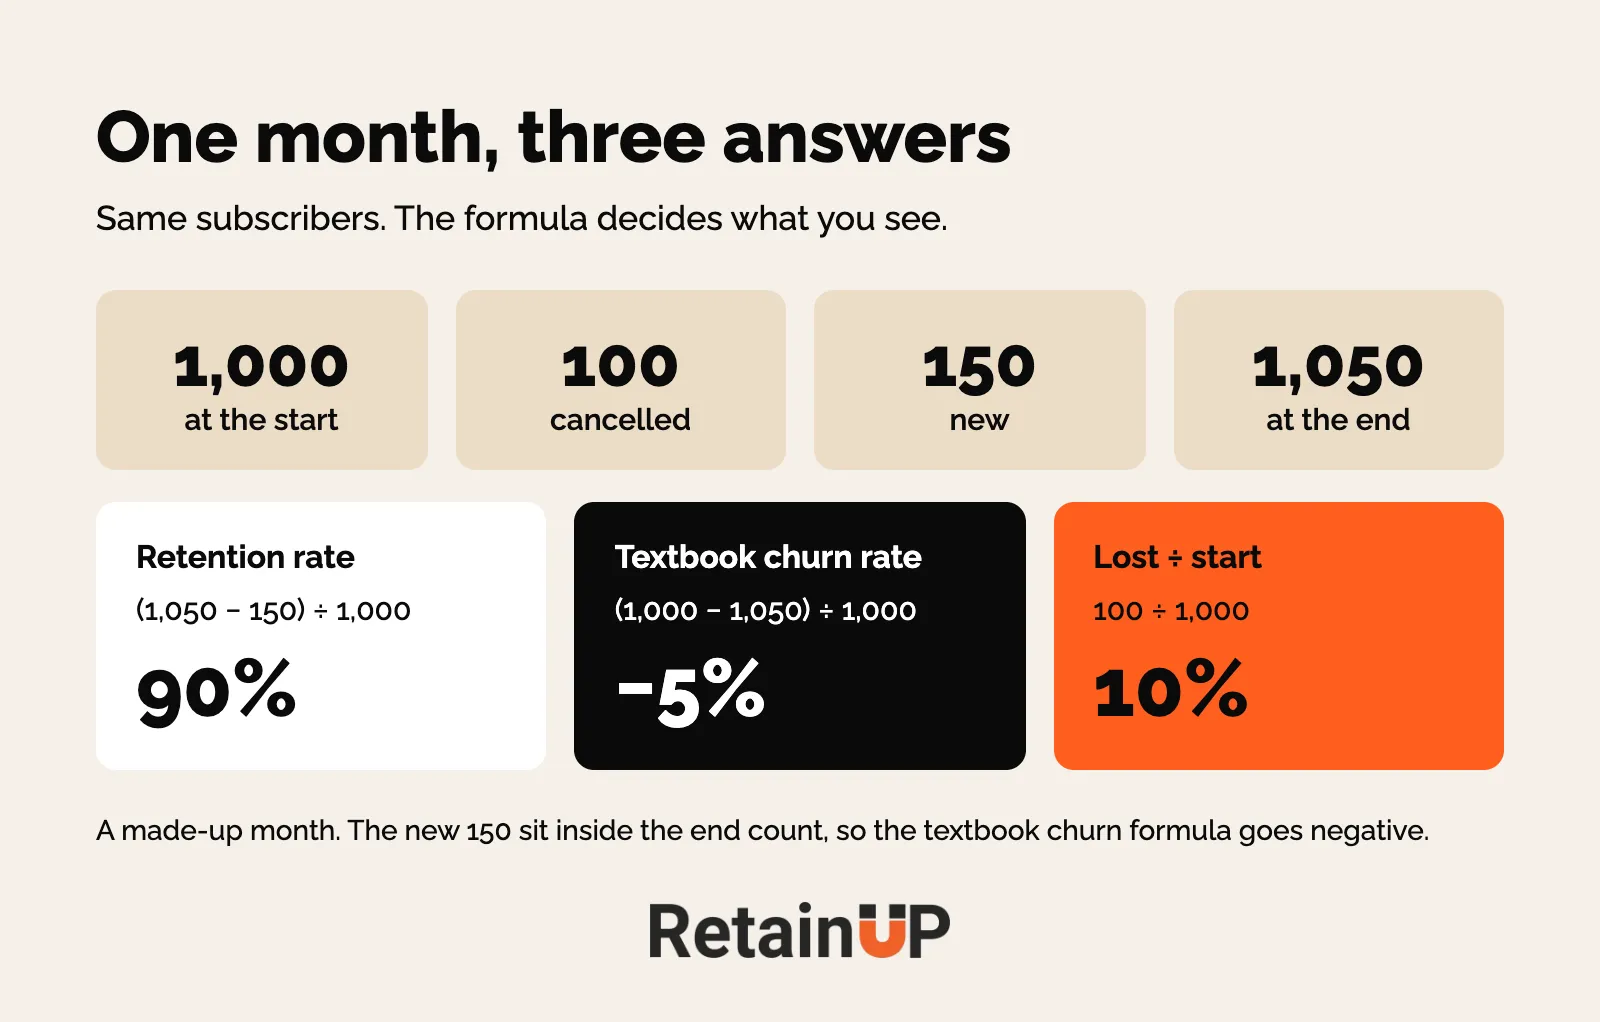
Say you start the month with 1,000 subscribers. 100 cancel. 150 new ones sign up. So you end on 1,050.
Retention = ((1,050 − 150) ÷ 1,000) × 100 = 90%. Fine.
Now run the textbook churn formula on the same month: (1,000 − 1,050) ÷ 1,000. That is minus 5%. Negative churn, in a month where 100 people left. Because the 150 new subscribers sit inside the end count. So count the leavers straight: 100 ÷ 1,000 = 10%.
Monthly retention compounds
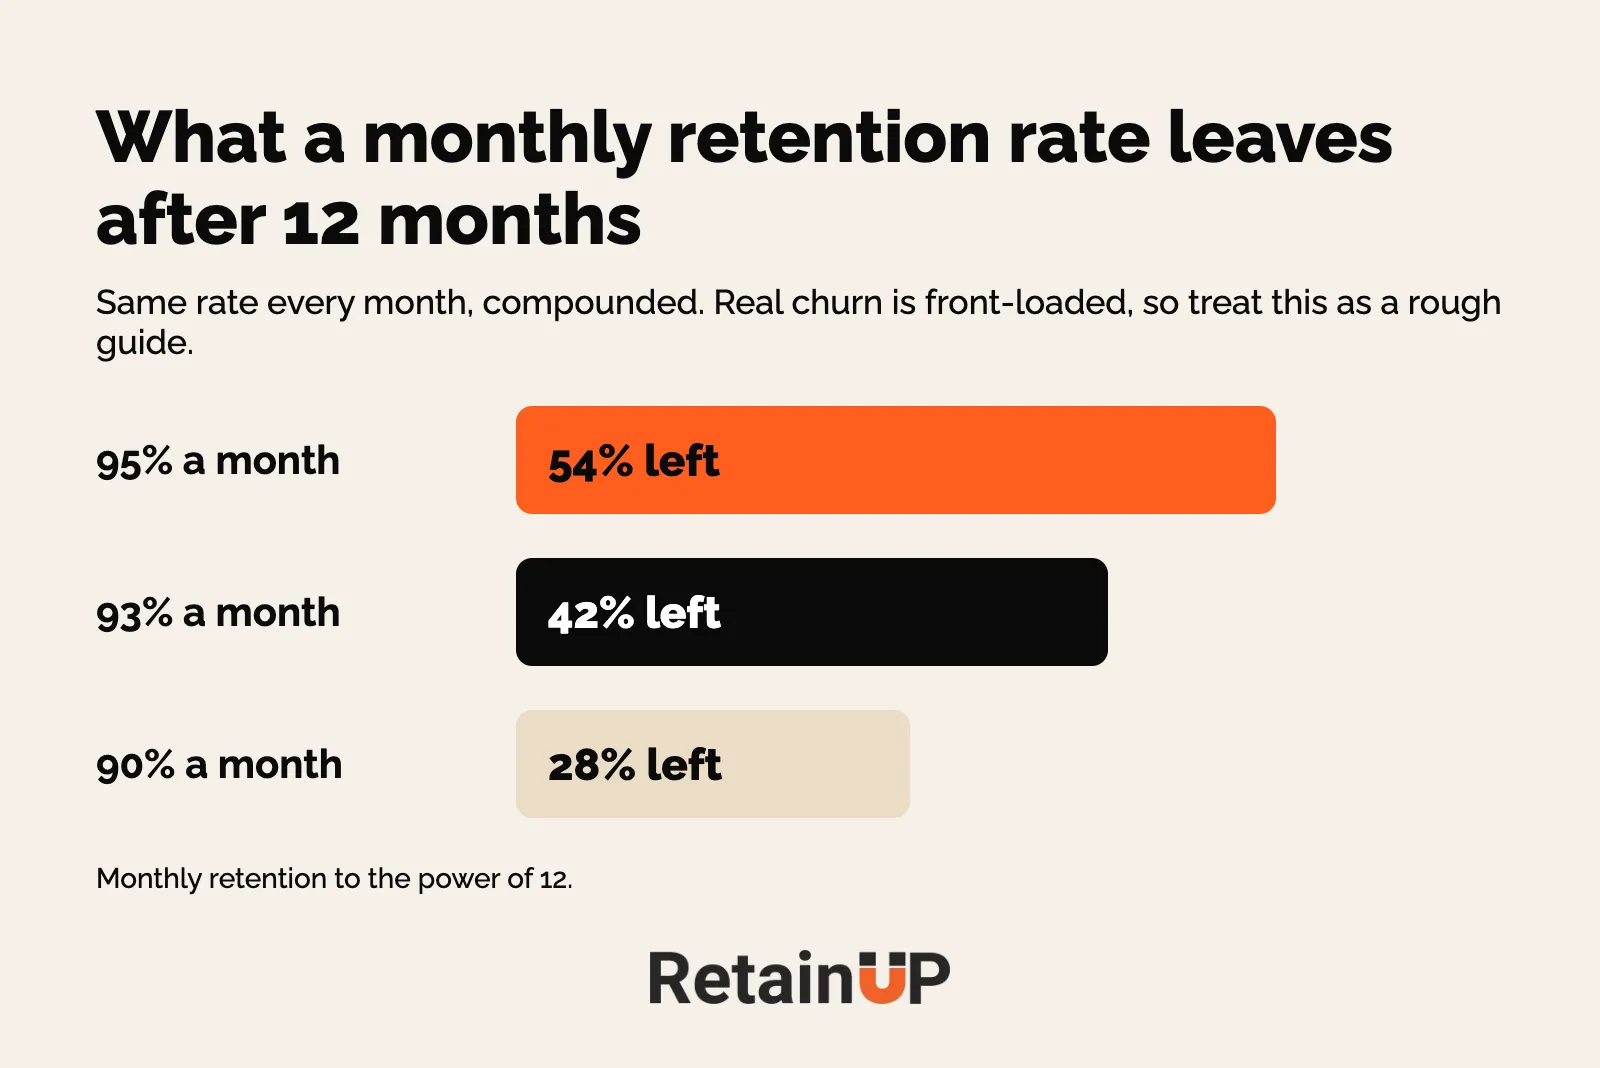
A 95% month sounds great. Over a year it is 0.95 to the power of 12, about 54%. So almost half are gone. At 90% a month, about 28% are left after 12 months. And real churn is front-loaded, so this flat math is only a rough guide.
The retention numbers your tools show you, and what each one hides
Everyone has a retention number. Most of them measure something else. Here are the ones you will run into, where they live, and what goes wrong with each.
| Metric | Formula | Where you see it | What it hides |
|---|---|---|---|
| Returning customer rate | Customers in the date range who had ordered before | Shopify dashboard | Counts anyone who ever came back, even after five years. Swings when you change the date range |
| Repeat purchase rate | Customers with 2+ orders ÷ all customers | Shopify, Lifetimely, Triple Whale | Built for one-time buyers. Depends entirely on the lookback window |
| 30 / 60 / 90 day retention | Still active X days after first order | Subscription app dashboards | At day 90 a monthly subscriber is on order 3 and a quarterly one is still on order 2. Mixed cadences blend into one number |
| Month 1 / 2 / 3 retention | Still active in calendar month X after start | Cohort tables in every tool | Same calendar problem. Skipped and paused subscribers count as retained |
| Monthly churn rate | Cancellations ÷ active subscribers this month | Recharge, Skio, Loop home dashboards | Partly measures billing frequency. New subscriber volume hides old ones leaving |
| Order 2 retention | Paid order 2 ÷ paid order 1 | Some subscription apps | Full of accidental subscribers and $0 trial starts |
| Order 2 to order 3 (conditional) | Paid order 3 ÷ paid order 2 | Rarely shown, usually derived | Hides everyone you lost before order 2 |
| Half-life | Months until 50% of a cohort is gone | Lifetimely, finance models | Needs years of history. Useless for a young brand |
| Revenue retention (NRR, GRR) | Revenue this year from last year's customers | Public company reports | Upsells and price rises hide subscriber loss. Hims & Hers reports 88% revenue retention, which says nothing about how many people stayed |
| Average number of months | Mean subscriber lifetime | Klaviyo | One average blends day-0 cancels and 3-year loyalists. Points at nothing |
| Year-1 Retention Efficiency | (R1 + R2 ... + R12) ÷ 12 | Thomas Lalas | Still month-based, and needs a full 12 months before you can read it |
Three of these you will see the most, so a little more on each.
Shopify returning customer rate
It's right there on your Shopify dashboard. Looks impressive. But it counts anyone who ever came back. Even after 5 years. Change the date range. Watch it swing. Polar Analytics shows one brand at 85% on a 12-month lookback and 41% on an all-time lookback, same customers. Not a metric you can build on.
Month 1 retention
Same calendar problem, and on top of that, skipped and paused subscribers count as retained. Thomas Lalas wrote about a founder who was proud of 90% month one retention. It was active subscribers, not people who paid. A third of those "active" ones had skipped their last three orders. You can read more on how skips hide in the base in skip and pause analysis.
Monthly churn rate
This sits on the home page of Recharge, Skio and Loop. It partly measures how often you bill. A weekly biller faces the stay-or-go decision 50 times a year, a quarterly biller 4. So a quarterly brand looks better on churn even with the same customers.
Recharge says this itself. Its help centre explains that the churn rate counts customers on each day of the period. It leaves out subscriptions set to expire after one charge. And it does not split churn by frequency. You do that yourself. Splitting that churn into cancels and failed charges is its own job, covered in active vs passive churn.
The formula we use: Order 3 retention
We track one number for every client. Just one. Order 3 retention.
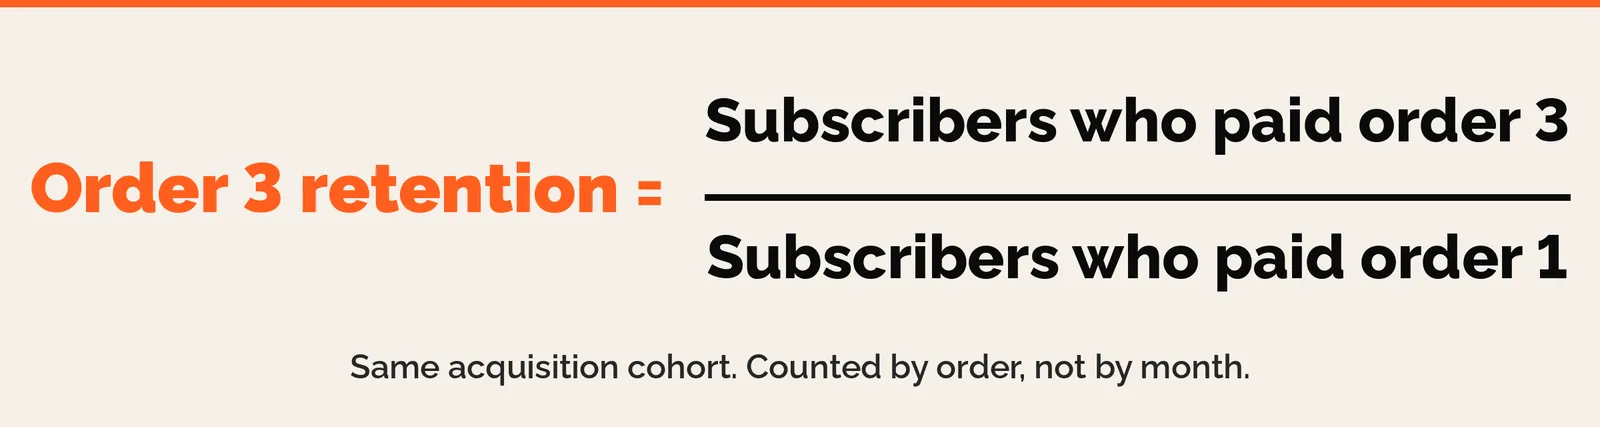
Order 3 retention = subscribers who paid order 3 ÷ subscribers who paid order 1, same acquisition cohort, × 100
The bottom of that fraction is always order 1. Every cohort starts there, every tool can show it, and nobody gets left out of the count. A cohort is everyone whose first order landed in the same month.
Example: 400 subscribers paid their first order in March. 236 paid order 3. 236 ÷ 400 = 59%.
Why order 3 and not 2 or 6? Short version. It counts by order, so monthly and quarterly plans compare fairly. Order 2 can be accidental. And most churn has already happened by then. The bands and the five rules for counting it live in Order 3 retention: the one number to track.
Calculating it by hand, or finding it in your app
Skio, Loop and Recharge each have an order-level view, and a Shopify export works when none of them do. The click paths and the sheet steps are on that same order 3 page.
If all you have is a month view, filter to one frequency first. On a 30-day plan, order 3 is month 2. On a 90-day plan, order 3 lands at month 6. Never convert a mixed-frequency cohort.
Count subscribers, not subscriptions
Check this before you read anything. Skio's cohort dashboard has a toggle: switch it to Subscribers, not Subscriptions. Recharge splits it the same way, with a customer churn dashboard and a subscription churn dashboard. A customer who holds two subscriptions and cancels one is still your customer.
And decide where a winback goes. Baremetrics puts a reactivated customer back in their original cohort, so the cohort keeps its true size. Whichever way you pick, write it next to the number, the same as pauses.
How to read a retention cohort table
The number lives in a cohort table. If you've never read one, it looks scary. It's really three moves.
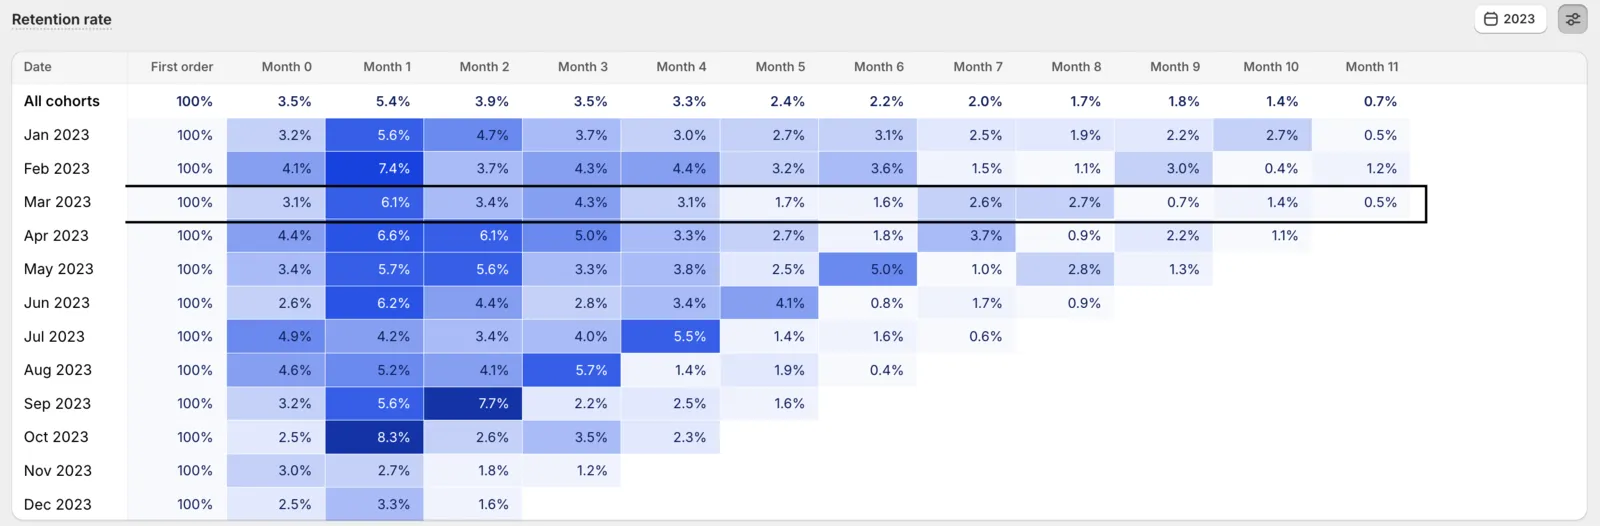
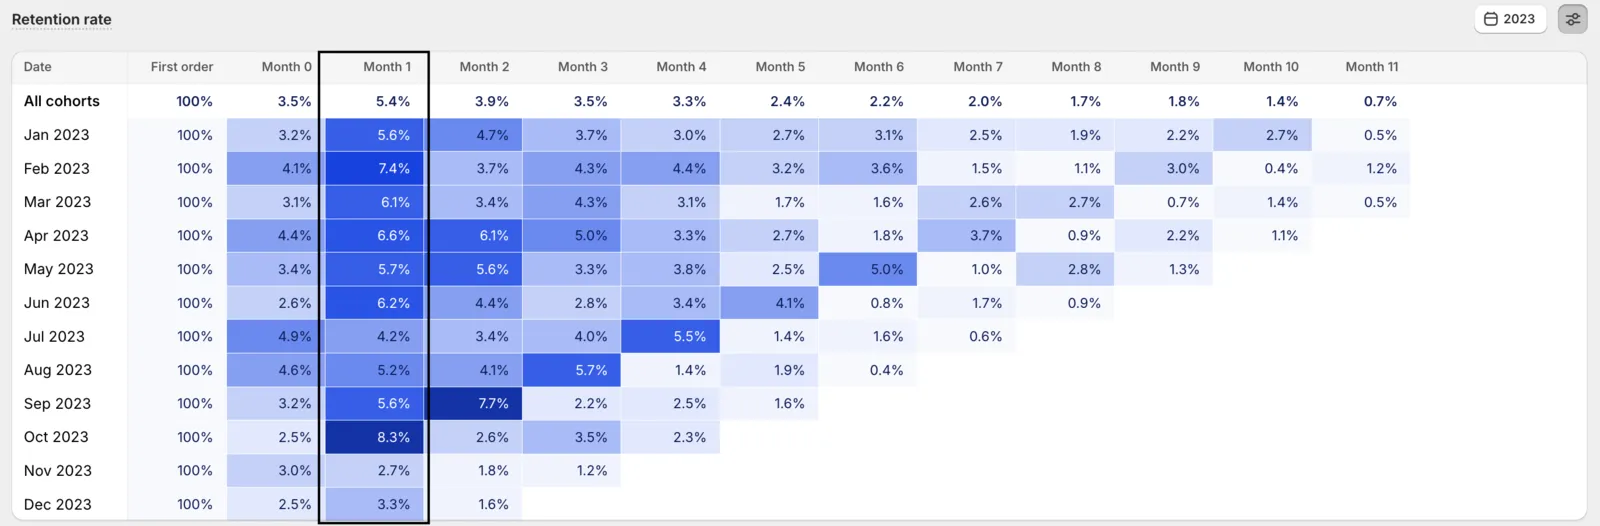
Rows are cohorts, everyone whose first order landed in the same month. Columns are periods since that first order: month 0, month 1, month 2, or order 1, order 2, order 3. The full method, with splits by offer, product and plan, is in subscription cohort analysis.
Read across a row
You see how one cohort decays over time.
Read down a column
You see if newer cohorts beat older ones. This is the only way to tell if your fixes worked.
Read the diagonal
You see one calendar month across every cohort. A bad shipping month or a price change shows up here.
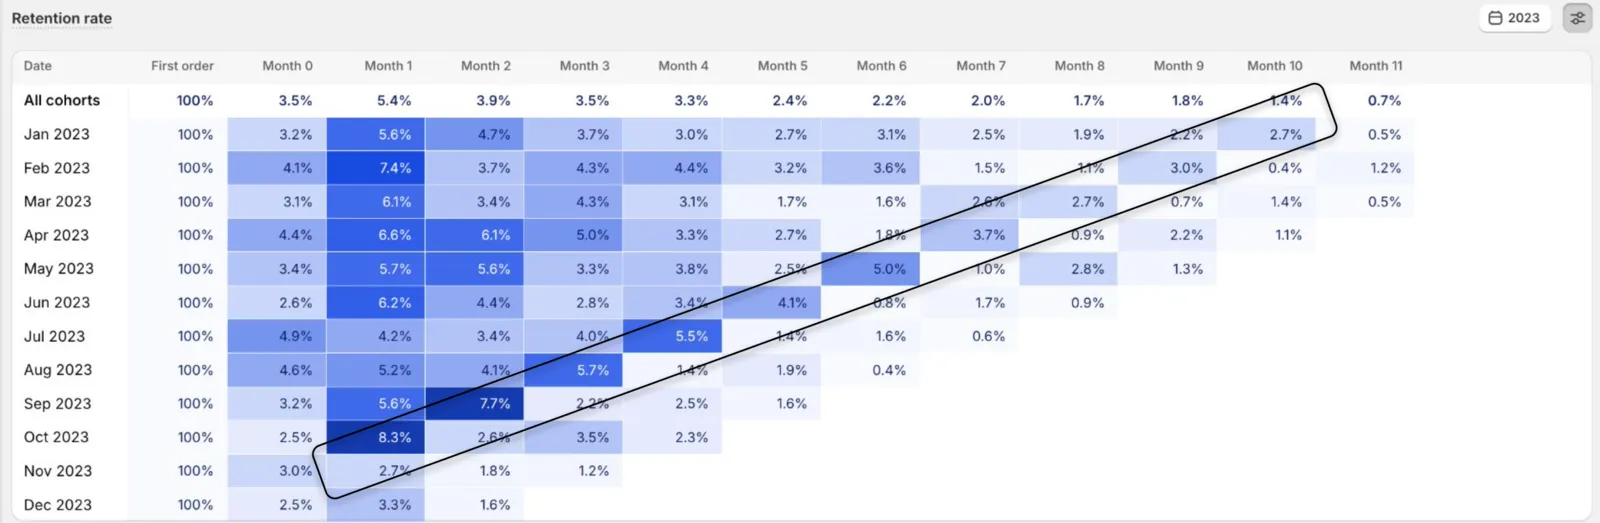
An offer change shows up here as a run of rows sitting well below the rows above them, starting the month the offer changed. So write down every offer change next to the cohort month. The freebie that won acquisition and then dropped its cohorts is in first-order offers that don't wreck the cohort.
Why month 0 is sometimes below 100%
Month 0 is the acquisition month. Everyone in the cohort placed order 1 there, so it is the 100% baseline every later column divides by.
But subscription apps often count subscriptions still active at the end of the month, not customers who ordered. Anyone who cancelled in their first month drops out before month 1 even starts. Three causes. Offer arbitrage: subscribe for the discount and gifts, cancel the same day. Surprise: they didn't realise they had subscribed. Or a failed first charge on a trial or $1 start.
In our own data, 5.6% of monthly-plan cancellations and 7.4% of quarterly-plan cancellations happen on day 0. A month 0 below about 95% is an offer or disclosure problem, not a product problem. The timing of those cancels is in cancellation day spikes.
Seasonal churn: why December and January look worse
Churn is seasonal. Churned's Subscription Retention Benchmark Report 2026 puts the peak in December and January, at about 4.1 to 4.3% a month. The lowest months are November, at 3.2%, and August to September.
So a January churn number next to November will look like something broke. It might not have. Compare a month against the same month last year. And read the diagonal of your cohort table to see if one calendar month hit every cohort at once.
Pauses are seasonal too. Recurly's 2026 State of Subscriptions has pauses rising from October through January, and unpauses climbing February to April. If your dashboard counts paused subscribers as retained, it looks kindest in the exact months churn is worst.
And it stacks with the Black Friday cohort. Those buyers are the first to cancel in January, as soon as the cohort matures. Read those rows on their own before you blame the season. What to do about that cohort is in BFCM for subscription brands.
What a good number looks like
Every source that publishes a retention benchmark sells retention software or services. That includes us. So check the definition before you compare, and use the numbers as ranges.
Skio and Recharge both publish order 3 numbers for supplement subscribers, and they sit roughly twice apart. Skio publishes no method, so you can't line the two up. The full list, each with its source and date, plus our own bands for supplements on a monthly plan, is on subscription benchmarks.
One more thing. Retention is a step on the way to money. Every rate on this page can be moved without anyone paying you again. So we judge every change against 12-month subscriber LTV, the cash a cohort actually paid.
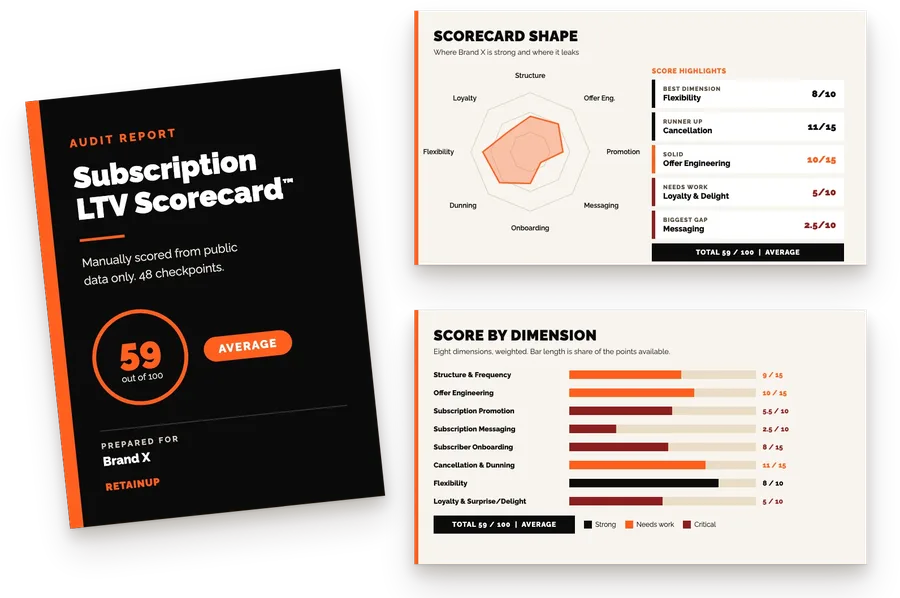
If you want your own order 3 retention pulled, cohort by cohort, the Subscription LTV Roadmap™ starts with a read of your subscription data and ends with a 90-day plan of 30 to 50 changes in order, in 3 working days, for $1,000. Or start with the free subscription audit: 48 checkpoints and your top 3 leaks, in 24 hours.
FAQ
How do I calculate subscription retention rate?
Take one cohort, everyone whose first paid order landed in the same month. Divide the subscribers who paid order 3 by the subscribers who paid order 1, then multiply by 100. If 400 subscribers started in March and 236 of them paid order 3, your order 3 retention is 59%. Only use cohorts old enough that everyone has passed their order 3 date plus 30 days.
What is the formula for customer retention rate?
The textbook formula is customers at the end of a period, minus new customers added in that period, divided by customers at the start, times 100. It works for SaaS. It breaks for subscriptions, because new subscribers hide the ones you lost, and it runs on calendar months while subscribers decide on their order date.
Is retention rate the same as 1 minus churn rate?
Not exactly. The textbook churn formula is customers at the start minus customers at the end, divided by customers at the start, so one minus churn still counts the new customers you added. In a month with more sign-ups than cancels it can even go negative. The retention formula subtracts new customers first. And monthly churn mixes every cohort, while order 3 retention follows one cohort by order.
Why is my month 0 retention below 100%?
Most subscription apps count subscriptions still active at the end of the month, so anyone who cancelled in their first month drops out. The usual causes are people subscribing for the discount and cancelling the same day, people who did not realise they subscribed, and failed first charges on trials. Below about 95% points at the offer or disclosure.
Why does subscription churn go up in January?
Churn is seasonal. Churned's 2026 benchmark report puts it at about 4.1 to 4.3% a month in December and January, against 3.2% in November. Black Friday buyers are also the first to cancel in January, once that cohort matures. Compare January against last January, not against November.
One email a week on subscription retention: the numbers, the strategy, and what to fix first.

Rahi Jain
Rahi Jain is a subscription LTV specialist who helps $1M to $10M DTC brands reduce subscription churn and maximize LTV on Recharge, Skio, Stay AI and Loop.
More about Rahi